Immigrants from Australia vs American In Labor Force | Age 16-19
COMPARE
Immigrants from Australia
American
In Labor Force | Age 16-19
In Labor Force | Age 16-19 Comparison
Immigrants from Australia
Americans
35.1%
IN LABOR FORCE | AGE 16-19
3.6/ 100
METRIC RATING
236th/ 347
METRIC RANK
40.3%
IN LABOR FORCE | AGE 16-19
100.0/ 100
METRIC RATING
61st/ 347
METRIC RANK
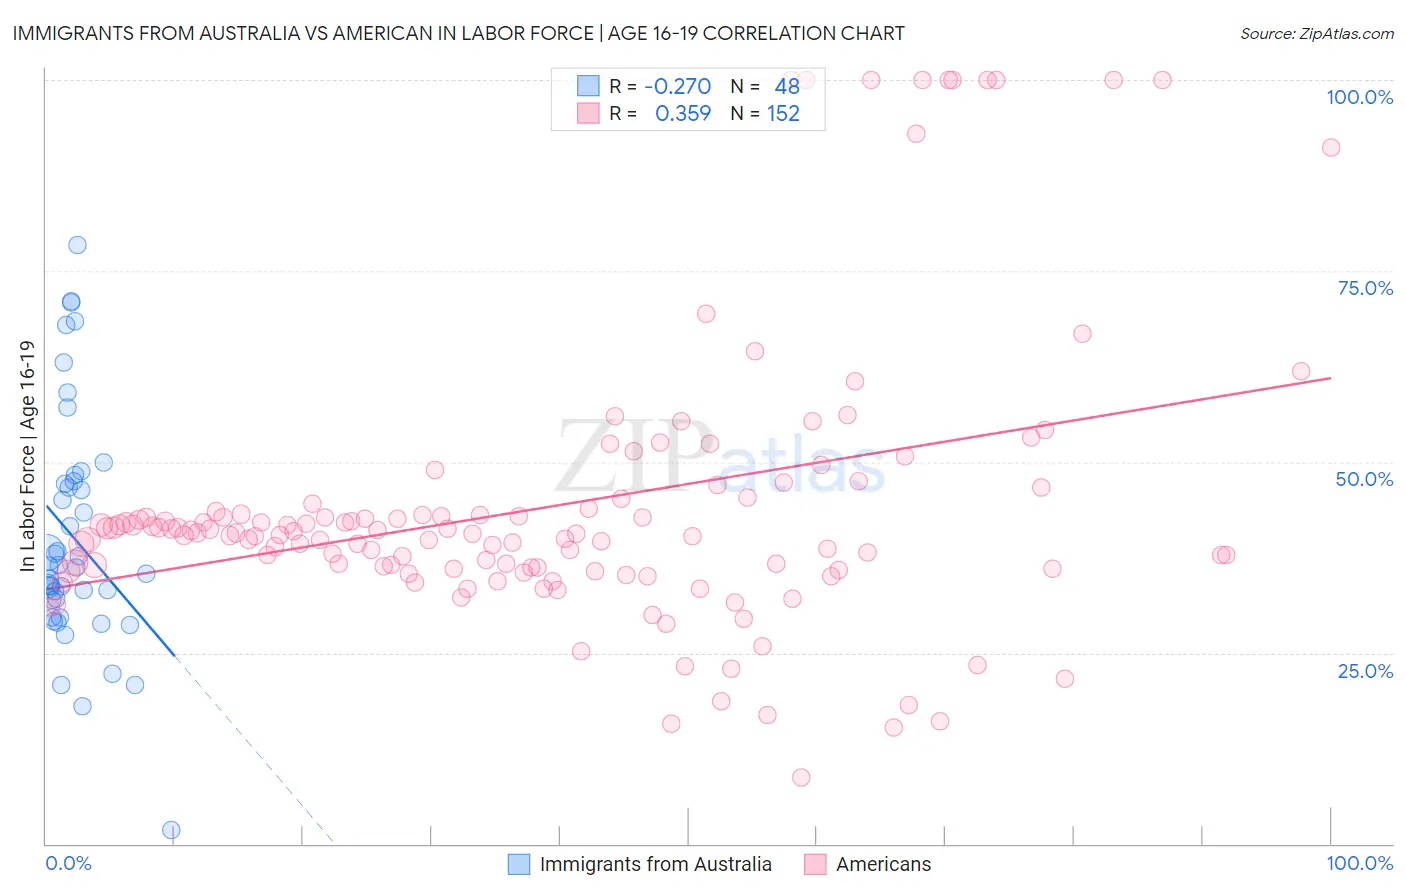
Immigrants from Australia vs American In Labor Force | Age 16-19 Correlation Chart
The statistical analysis conducted on geographies consisting of 226,866,182 people shows a weak negative correlation between the proportion of Immigrants from Australia and labor force participation rate among population between the ages 16 and 19 in the United States with a correlation coefficient (R) of -0.270 and weighted average of 35.1%. Similarly, the statistical analysis conducted on geographies consisting of 576,408,281 people shows a mild positive correlation between the proportion of Americans and labor force participation rate among population between the ages 16 and 19 in the United States with a correlation coefficient (R) of 0.359 and weighted average of 40.3%, a difference of 15.0%.
In Labor Force | Age 16-19 Correlation Summary
| Measurement | Immigrants from Australia | American |
| Minimum | 1.8% | 8.6% |
| Maximum | 78.4% | 100.0% |
| Range | 76.6% | 91.4% |
| Mean | 39.9% | 44.1% |
| Median | 36.2% | 40.6% |
| Interquartile 25% (IQ1) | 30.8% | 36.0% |
| Interquartile 75% (IQ3) | 47.3% | 43.6% |
| Interquartile Range (IQR) | 16.5% | 7.6% |
| Standard Deviation (Sample) | 15.3% | 18.5% |
| Standard Deviation (Population) | 15.2% | 18.5% |
Similar Demographics by In Labor Force | Age 16-19
Demographics Similar to Immigrants from Australia by In Labor Force | Age 16-19
In terms of in labor force | age 16-19, the demographic groups most similar to Immigrants from Australia are Immigrants from India (35.0%, a difference of 0.030%), Immigrants from Vietnam (35.0%, a difference of 0.070%), Immigrants from Philippines (35.1%, a difference of 0.14%), Inupiat (35.0%, a difference of 0.16%), and Immigrants from Mexico (35.1%, a difference of 0.22%).
| Demographics | Rating | Rank | In Labor Force | Age 16-19 |
| Immigrants | Lebanon | 5.0 /100 | #229 | Tragic 35.2% |
| Immigrants | Honduras | 4.9 /100 | #230 | Tragic 35.2% |
| Immigrants | Syria | 4.5 /100 | #231 | Tragic 35.2% |
| Immigrants | Kazakhstan | 4.5 /100 | #232 | Tragic 35.2% |
| Immigrants | France | 4.3 /100 | #233 | Tragic 35.1% |
| Immigrants | Mexico | 4.2 /100 | #234 | Tragic 35.1% |
| Immigrants | Philippines | 4.0 /100 | #235 | Tragic 35.1% |
| Immigrants | Australia | 3.6 /100 | #236 | Tragic 35.1% |
| Immigrants | India | 3.5 /100 | #237 | Tragic 35.0% |
| Immigrants | Vietnam | 3.4 /100 | #238 | Tragic 35.0% |
| Inupiat | 3.2 /100 | #239 | Tragic 35.0% |
| Immigrants | Central America | 3.0 /100 | #240 | Tragic 35.0% |
| Immigrants | Ireland | 2.9 /100 | #241 | Tragic 35.0% |
| Uruguayans | 2.6 /100 | #242 | Tragic 34.9% |
| Pueblo | 2.6 /100 | #243 | Tragic 34.9% |
Demographics Similar to Americans by In Labor Force | Age 16-19
In terms of in labor force | age 16-19, the demographic groups most similar to Americans are Cherokee (40.2%, a difference of 0.14%), Immigrants from Eastern Africa (40.4%, a difference of 0.15%), Slavic (40.4%, a difference of 0.19%), Northern European (40.2%, a difference of 0.20%), and Immigrants from Micronesia (40.2%, a difference of 0.31%).
| Demographics | Rating | Rank | In Labor Force | Age 16-19 |
| Tlingit-Haida | 100.0 /100 | #54 | Exceptional 40.5% |
| British | 100.0 /100 | #55 | Exceptional 40.5% |
| Fijians | 100.0 /100 | #56 | Exceptional 40.4% |
| Lithuanians | 100.0 /100 | #57 | Exceptional 40.4% |
| Aleuts | 100.0 /100 | #58 | Exceptional 40.4% |
| Slavs | 100.0 /100 | #59 | Exceptional 40.4% |
| Immigrants | Eastern Africa | 100.0 /100 | #60 | Exceptional 40.4% |
| Americans | 100.0 /100 | #61 | Exceptional 40.3% |
| Cherokee | 100.0 /100 | #62 | Exceptional 40.2% |
| Northern Europeans | 100.0 /100 | #63 | Exceptional 40.2% |
| Immigrants | Micronesia | 100.0 /100 | #64 | Exceptional 40.2% |
| Kenyans | 100.0 /100 | #65 | Exceptional 40.1% |
| Immigrants | Nonimmigrants | 100.0 /100 | #66 | Exceptional 40.1% |
| Canadians | 100.0 /100 | #67 | Exceptional 40.1% |
| Italians | 99.9 /100 | #68 | Exceptional 40.1% |