New Zealander vs American In Labor Force | Age 16-19
COMPARE
New Zealander
American
In Labor Force | Age 16-19
In Labor Force | Age 16-19 Comparison
New Zealanders
Americans
38.0%
IN LABOR FORCE | AGE 16-19
95.6/ 100
METRIC RATING
128th/ 347
METRIC RANK
40.3%
IN LABOR FORCE | AGE 16-19
100.0/ 100
METRIC RATING
61st/ 347
METRIC RANK
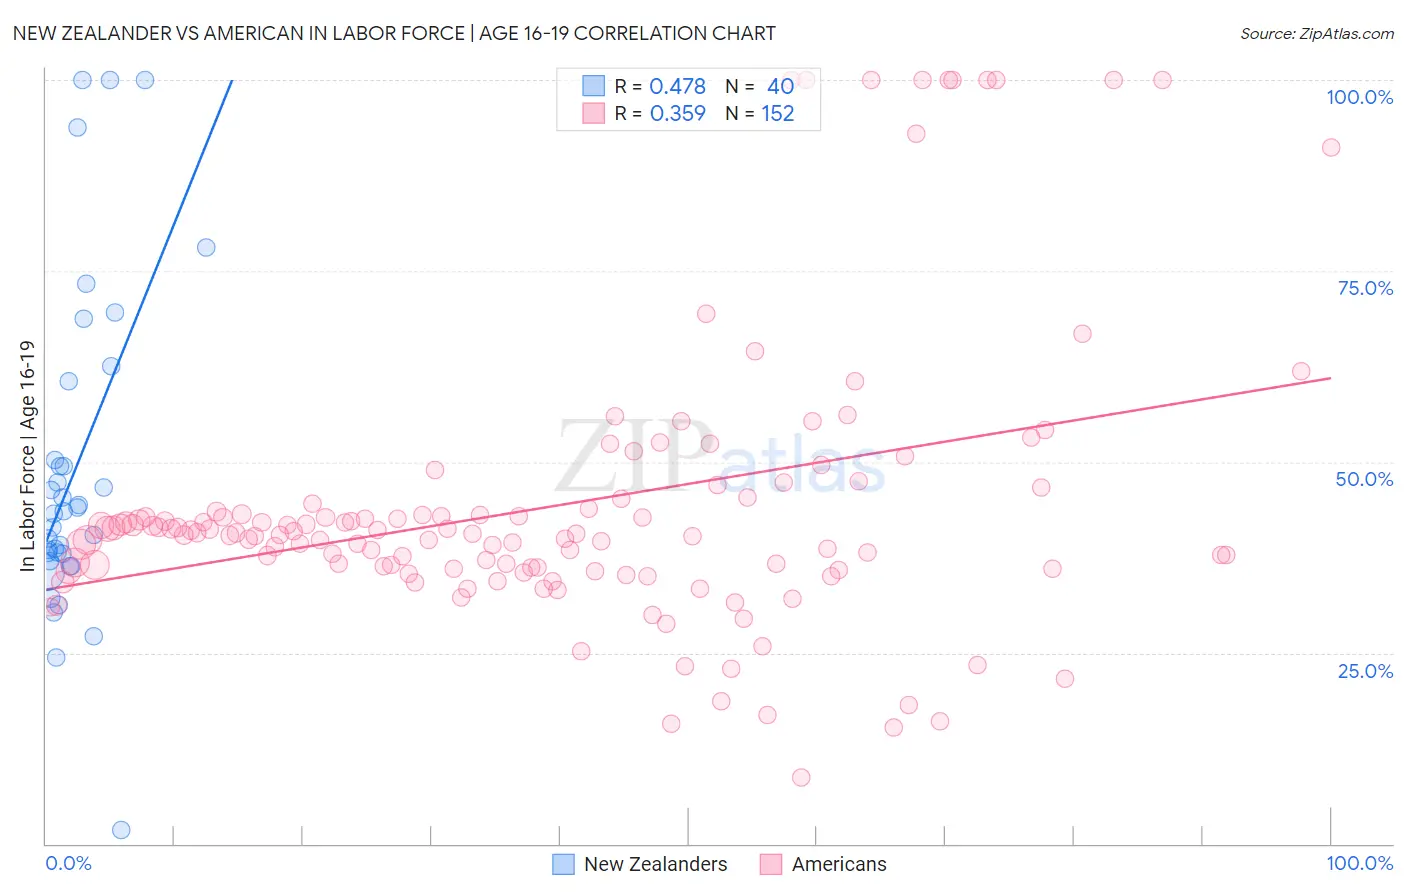
New Zealander vs American In Labor Force | Age 16-19 Correlation Chart
The statistical analysis conducted on geographies consisting of 106,856,856 people shows a moderate positive correlation between the proportion of New Zealanders and labor force participation rate among population between the ages 16 and 19 in the United States with a correlation coefficient (R) of 0.478 and weighted average of 38.0%. Similarly, the statistical analysis conducted on geographies consisting of 576,408,281 people shows a mild positive correlation between the proportion of Americans and labor force participation rate among population between the ages 16 and 19 in the United States with a correlation coefficient (R) of 0.359 and weighted average of 40.3%, a difference of 6.1%.
In Labor Force | Age 16-19 Correlation Summary
| Measurement | New Zealander | American |
| Minimum | 1.8% | 8.6% |
| Maximum | 100.0% | 100.0% |
| Range | 98.2% | 91.4% |
| Mean | 49.0% | 44.1% |
| Median | 43.4% | 40.6% |
| Interquartile 25% (IQ1) | 37.5% | 36.0% |
| Interquartile 75% (IQ3) | 55.4% | 43.6% |
| Interquartile Range (IQR) | 17.8% | 7.6% |
| Standard Deviation (Sample) | 21.7% | 18.5% |
| Standard Deviation (Population) | 21.4% | 18.5% |
Similar Demographics by In Labor Force | Age 16-19
Demographics Similar to New Zealanders by In Labor Force | Age 16-19
In terms of in labor force | age 16-19, the demographic groups most similar to New Zealanders are Choctaw (38.0%, a difference of 0.0%), African (38.0%, a difference of 0.010%), Spaniard (38.0%, a difference of 0.020%), Immigrants from Zimbabwe (38.0%, a difference of 0.050%), and Immigrants from Austria (37.9%, a difference of 0.15%).
| Demographics | Rating | Rank | In Labor Force | Age 16-19 |
| Ethiopians | 97.4 /100 | #121 | Exceptional 38.2% |
| Guamanians/Chamorros | 97.4 /100 | #122 | Exceptional 38.2% |
| Seminole | 96.7 /100 | #123 | Exceptional 38.1% |
| Immigrants | England | 96.4 /100 | #124 | Exceptional 38.1% |
| Immigrants | Africa | 96.1 /100 | #125 | Exceptional 38.0% |
| Africans | 95.6 /100 | #126 | Exceptional 38.0% |
| Choctaw | 95.6 /100 | #127 | Exceptional 38.0% |
| New Zealanders | 95.6 /100 | #128 | Exceptional 38.0% |
| Spaniards | 95.5 /100 | #129 | Exceptional 38.0% |
| Immigrants | Zimbabwe | 95.4 /100 | #130 | Exceptional 38.0% |
| Immigrants | Austria | 95.0 /100 | #131 | Exceptional 37.9% |
| Immigrants | Oceania | 94.7 /100 | #132 | Exceptional 37.9% |
| Cheyenne | 94.6 /100 | #133 | Exceptional 37.9% |
| Immigrants | Netherlands | 93.7 /100 | #134 | Exceptional 37.8% |
| Macedonians | 93.4 /100 | #135 | Exceptional 37.8% |
Demographics Similar to Americans by In Labor Force | Age 16-19
In terms of in labor force | age 16-19, the demographic groups most similar to Americans are Cherokee (40.2%, a difference of 0.14%), Immigrants from Eastern Africa (40.4%, a difference of 0.15%), Slavic (40.4%, a difference of 0.19%), Northern European (40.2%, a difference of 0.20%), and Immigrants from Micronesia (40.2%, a difference of 0.31%).
| Demographics | Rating | Rank | In Labor Force | Age 16-19 |
| Tlingit-Haida | 100.0 /100 | #54 | Exceptional 40.5% |
| British | 100.0 /100 | #55 | Exceptional 40.5% |
| Fijians | 100.0 /100 | #56 | Exceptional 40.4% |
| Lithuanians | 100.0 /100 | #57 | Exceptional 40.4% |
| Aleuts | 100.0 /100 | #58 | Exceptional 40.4% |
| Slavs | 100.0 /100 | #59 | Exceptional 40.4% |
| Immigrants | Eastern Africa | 100.0 /100 | #60 | Exceptional 40.4% |
| Americans | 100.0 /100 | #61 | Exceptional 40.3% |
| Cherokee | 100.0 /100 | #62 | Exceptional 40.2% |
| Northern Europeans | 100.0 /100 | #63 | Exceptional 40.2% |
| Immigrants | Micronesia | 100.0 /100 | #64 | Exceptional 40.2% |
| Kenyans | 100.0 /100 | #65 | Exceptional 40.1% |
| Immigrants | Nonimmigrants | 100.0 /100 | #66 | Exceptional 40.1% |
| Canadians | 100.0 /100 | #67 | Exceptional 40.1% |
| Italians | 99.9 /100 | #68 | Exceptional 40.1% |