Immigrants from Egypt vs American In Labor Force | Age 16-19
COMPARE
Immigrants from Egypt
American
In Labor Force | Age 16-19
In Labor Force | Age 16-19 Comparison
Immigrants from Egypt
Americans
34.6%
IN LABOR FORCE | AGE 16-19
1.2/ 100
METRIC RATING
257th/ 347
METRIC RANK
40.3%
IN LABOR FORCE | AGE 16-19
100.0/ 100
METRIC RATING
61st/ 347
METRIC RANK
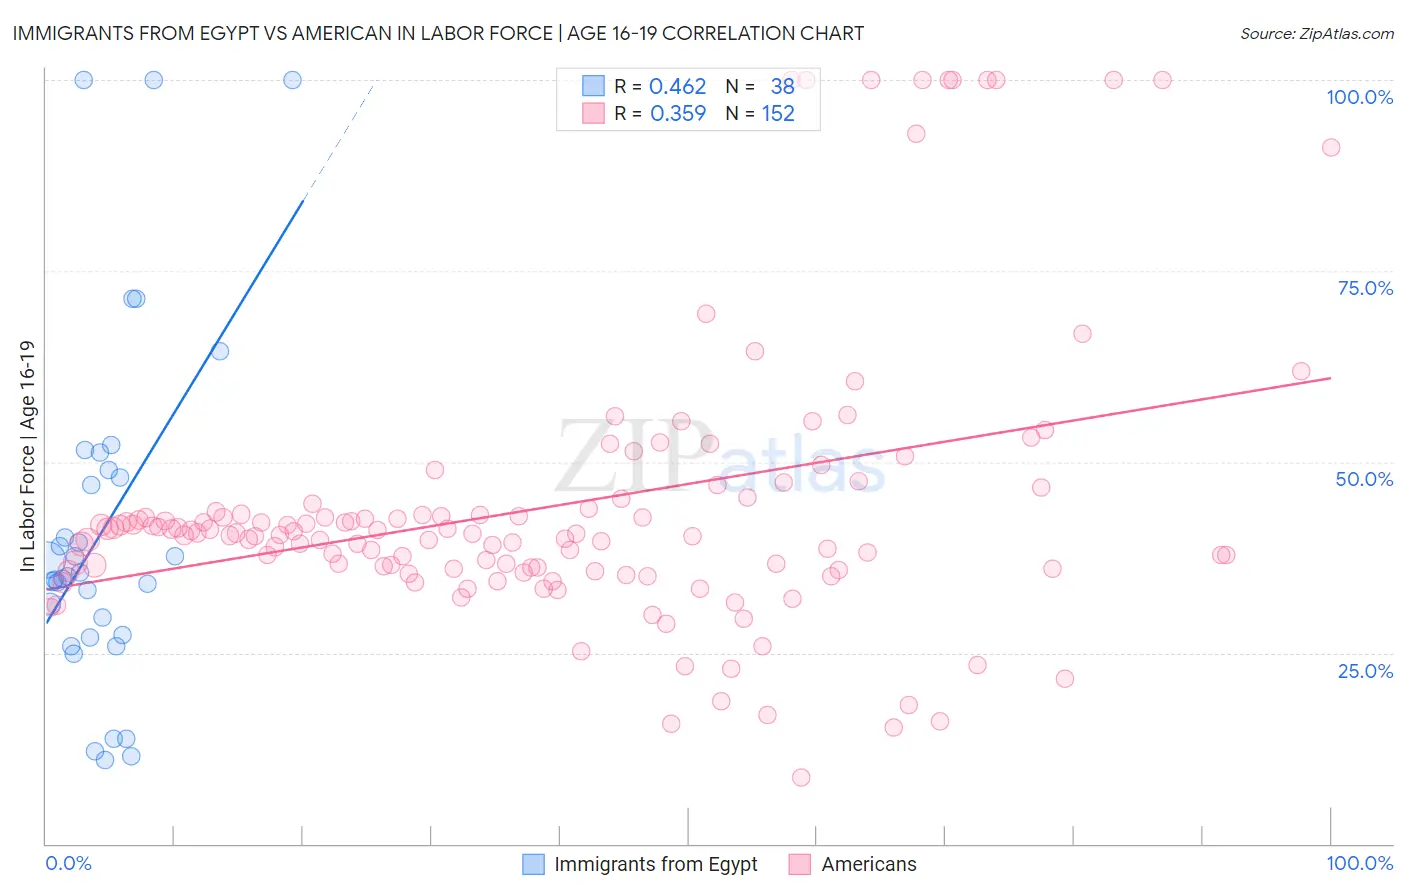
Immigrants from Egypt vs American In Labor Force | Age 16-19 Correlation Chart
The statistical analysis conducted on geographies consisting of 245,278,440 people shows a moderate positive correlation between the proportion of Immigrants from Egypt and labor force participation rate among population between the ages 16 and 19 in the United States with a correlation coefficient (R) of 0.462 and weighted average of 34.6%. Similarly, the statistical analysis conducted on geographies consisting of 576,408,281 people shows a mild positive correlation between the proportion of Americans and labor force participation rate among population between the ages 16 and 19 in the United States with a correlation coefficient (R) of 0.359 and weighted average of 40.3%, a difference of 16.6%.
In Labor Force | Age 16-19 Correlation Summary
| Measurement | Immigrants from Egypt | American |
| Minimum | 11.0% | 8.6% |
| Maximum | 100.0% | 100.0% |
| Range | 89.0% | 91.4% |
| Mean | 41.2% | 44.1% |
| Median | 35.3% | 40.6% |
| Interquartile 25% (IQ1) | 27.4% | 36.0% |
| Interquartile 75% (IQ3) | 48.9% | 43.6% |
| Interquartile Range (IQR) | 21.5% | 7.6% |
| Standard Deviation (Sample) | 22.7% | 18.5% |
| Standard Deviation (Population) | 22.4% | 18.5% |
Similar Demographics by In Labor Force | Age 16-19
Demographics Similar to Immigrants from Egypt by In Labor Force | Age 16-19
In terms of in labor force | age 16-19, the demographic groups most similar to Immigrants from Egypt are Immigrants from South Central Asia (34.6%, a difference of 0.010%), Thai (34.6%, a difference of 0.010%), Immigrants (34.6%, a difference of 0.020%), Egyptian (34.5%, a difference of 0.10%), and Peruvian (34.6%, a difference of 0.11%).
| Demographics | Rating | Rank | In Labor Force | Age 16-19 |
| Immigrants | Pakistan | 2.0 /100 | #250 | Tragic 34.8% |
| Immigrants | Western Asia | 2.0 /100 | #251 | Tragic 34.8% |
| Immigrants | Chile | 2.0 /100 | #252 | Tragic 34.8% |
| Immigrants | Japan | 1.5 /100 | #253 | Tragic 34.7% |
| Bahamians | 1.4 /100 | #254 | Tragic 34.6% |
| Peruvians | 1.4 /100 | #255 | Tragic 34.6% |
| Immigrants | South Central Asia | 1.3 /100 | #256 | Tragic 34.6% |
| Immigrants | Egypt | 1.2 /100 | #257 | Tragic 34.6% |
| Thais | 1.2 /100 | #258 | Tragic 34.6% |
| Immigrants | Immigrants | 1.2 /100 | #259 | Tragic 34.6% |
| Egyptians | 1.2 /100 | #260 | Tragic 34.5% |
| Salvadorans | 1.1 /100 | #261 | Tragic 34.5% |
| Hispanics or Latinos | 1.1 /100 | #262 | Tragic 34.5% |
| Burmese | 1.1 /100 | #263 | Tragic 34.5% |
| Immigrants | Uruguay | 0.9 /100 | #264 | Tragic 34.4% |
Demographics Similar to Americans by In Labor Force | Age 16-19
In terms of in labor force | age 16-19, the demographic groups most similar to Americans are Cherokee (40.2%, a difference of 0.14%), Immigrants from Eastern Africa (40.4%, a difference of 0.15%), Slavic (40.4%, a difference of 0.19%), Northern European (40.2%, a difference of 0.20%), and Immigrants from Micronesia (40.2%, a difference of 0.31%).
| Demographics | Rating | Rank | In Labor Force | Age 16-19 |
| Tlingit-Haida | 100.0 /100 | #54 | Exceptional 40.5% |
| British | 100.0 /100 | #55 | Exceptional 40.5% |
| Fijians | 100.0 /100 | #56 | Exceptional 40.4% |
| Lithuanians | 100.0 /100 | #57 | Exceptional 40.4% |
| Aleuts | 100.0 /100 | #58 | Exceptional 40.4% |
| Slavs | 100.0 /100 | #59 | Exceptional 40.4% |
| Immigrants | Eastern Africa | 100.0 /100 | #60 | Exceptional 40.4% |
| Americans | 100.0 /100 | #61 | Exceptional 40.3% |
| Cherokee | 100.0 /100 | #62 | Exceptional 40.2% |
| Northern Europeans | 100.0 /100 | #63 | Exceptional 40.2% |
| Immigrants | Micronesia | 100.0 /100 | #64 | Exceptional 40.2% |
| Kenyans | 100.0 /100 | #65 | Exceptional 40.1% |
| Immigrants | Nonimmigrants | 100.0 /100 | #66 | Exceptional 40.1% |
| Canadians | 100.0 /100 | #67 | Exceptional 40.1% |
| Italians | 99.9 /100 | #68 | Exceptional 40.1% |