Immigrants from Sudan vs Native/Alaskan In Labor Force | Age 20-64
COMPARE
Immigrants from Sudan
Native/Alaskan
In Labor Force | Age 20-64
In Labor Force | Age 20-64 Comparison
Immigrants from Sudan
Natives/Alaskans
80.4%
IN LABOR FORCE | AGE 20-64
99.4/ 100
METRIC RATING
50th/ 347
METRIC RANK
73.9%
IN LABOR FORCE | AGE 20-64
0.0/ 100
METRIC RATING
333rd/ 347
METRIC RANK
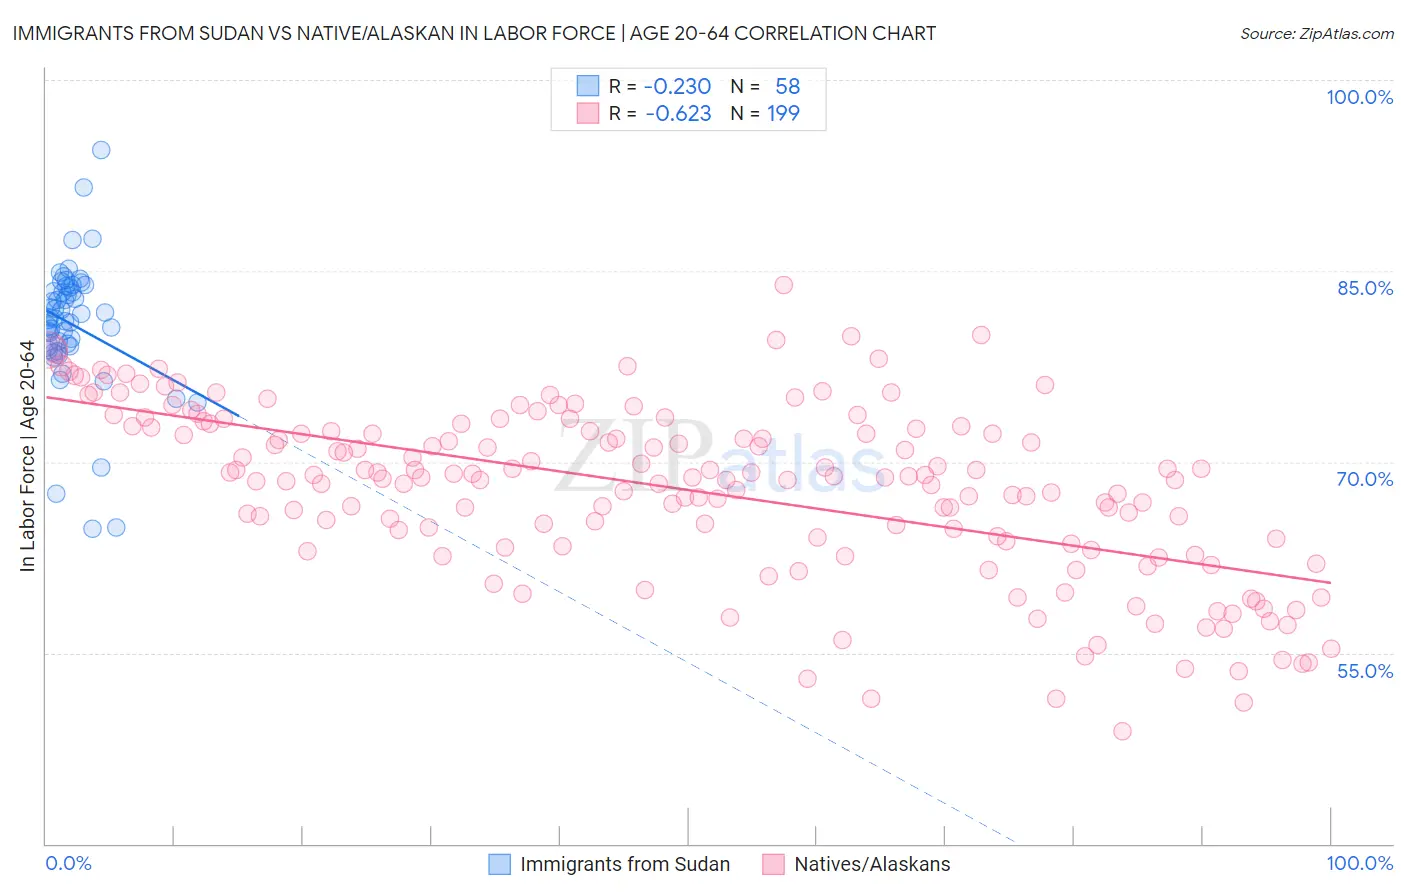
Immigrants from Sudan vs Native/Alaskan In Labor Force | Age 20-64 Correlation Chart
The statistical analysis conducted on geographies consisting of 118,972,362 people shows a weak negative correlation between the proportion of Immigrants from Sudan and labor force participation rate among population between the ages 20 and 64 in the United States with a correlation coefficient (R) of -0.230 and weighted average of 80.4%. Similarly, the statistical analysis conducted on geographies consisting of 513,028,645 people shows a significant negative correlation between the proportion of Natives/Alaskans and labor force participation rate among population between the ages 20 and 64 in the United States with a correlation coefficient (R) of -0.623 and weighted average of 73.9%, a difference of 8.8%.
In Labor Force | Age 20-64 Correlation Summary
| Measurement | Immigrants from Sudan | Native/Alaskan |
| Minimum | 64.7% | 48.8% |
| Maximum | 94.5% | 83.9% |
| Range | 29.8% | 35.1% |
| Mean | 80.8% | 67.8% |
| Median | 81.3% | 68.8% |
| Interquartile 25% (IQ1) | 79.1% | 63.6% |
| Interquartile 75% (IQ3) | 83.7% | 72.7% |
| Interquartile Range (IQR) | 4.6% | 9.2% |
| Standard Deviation (Sample) | 5.2% | 6.8% |
| Standard Deviation (Population) | 5.2% | 6.8% |
Similar Demographics by In Labor Force | Age 20-64
Demographics Similar to Immigrants from Sudan by In Labor Force | Age 20-64
In terms of in labor force | age 20-64, the demographic groups most similar to Immigrants from Sudan are Immigrants from Greece (80.4%, a difference of 0.020%), Immigrants from Sri Lanka (80.4%, a difference of 0.030%), Turkish (80.3%, a difference of 0.040%), Immigrants from Hong Kong (80.4%, a difference of 0.050%), and Immigrants from Peru (80.3%, a difference of 0.060%).
| Demographics | Rating | Rank | In Labor Force | Age 20-64 |
| Czechs | 99.7 /100 | #43 | Exceptional 80.5% |
| Immigrants | Middle Africa | 99.7 /100 | #44 | Exceptional 80.5% |
| Slovenes | 99.7 /100 | #45 | Exceptional 80.5% |
| Immigrants | Pakistan | 99.6 /100 | #46 | Exceptional 80.5% |
| Immigrants | Africa | 99.6 /100 | #47 | Exceptional 80.4% |
| Immigrants | Hong Kong | 99.5 /100 | #48 | Exceptional 80.4% |
| Immigrants | Greece | 99.4 /100 | #49 | Exceptional 80.4% |
| Immigrants | Sudan | 99.4 /100 | #50 | Exceptional 80.4% |
| Immigrants | Sri Lanka | 99.3 /100 | #51 | Exceptional 80.4% |
| Turks | 99.2 /100 | #52 | Exceptional 80.3% |
| Immigrants | Peru | 99.2 /100 | #53 | Exceptional 80.3% |
| Peruvians | 99.1 /100 | #54 | Exceptional 80.3% |
| Immigrants | Cabo Verde | 99.0 /100 | #55 | Exceptional 80.3% |
| Immigrants | Northern Africa | 99.0 /100 | #56 | Exceptional 80.3% |
| Afghans | 98.9 /100 | #57 | Exceptional 80.3% |
Demographics Similar to Natives/Alaskans by In Labor Force | Age 20-64
In terms of in labor force | age 20-64, the demographic groups most similar to Natives/Alaskans are Apache (73.7%, a difference of 0.30%), Ute (73.7%, a difference of 0.32%), Arapaho (74.4%, a difference of 0.66%), Crow (73.3%, a difference of 0.83%), and Yup'ik (73.2%, a difference of 0.95%).
| Demographics | Rating | Rank | In Labor Force | Age 20-64 |
| Creek | 0.0 /100 | #326 | Tragic 75.1% |
| Sioux | 0.0 /100 | #327 | Tragic 75.0% |
| Kiowa | 0.0 /100 | #328 | Tragic 75.0% |
| Cheyenne | 0.0 /100 | #329 | Tragic 74.8% |
| Colville | 0.0 /100 | #330 | Tragic 74.8% |
| Paiute | 0.0 /100 | #331 | Tragic 74.7% |
| Arapaho | 0.0 /100 | #332 | Tragic 74.4% |
| Natives/Alaskans | 0.0 /100 | #333 | Tragic 73.9% |
| Apache | 0.0 /100 | #334 | Tragic 73.7% |
| Ute | 0.0 /100 | #335 | Tragic 73.7% |
| Crow | 0.0 /100 | #336 | Tragic 73.3% |
| Yup'ik | 0.0 /100 | #337 | Tragic 73.2% |
| Puerto Ricans | 0.0 /100 | #338 | Tragic 73.1% |
| Houma | 0.0 /100 | #339 | Tragic 72.7% |
| Pueblo | 0.0 /100 | #340 | Tragic 72.6% |