Slovak vs Native/Alaskan In Labor Force | Age 20-64

COMPARE

Slovak
Race
Ancestry
AfghanAfricanAlaska NativeAlaskan AthabascanAlbanianAleutAlsatianAmericanApacheArabArapahoArgentineanArmenianAssyrian/Chaldean/SyriacAustralianAustrianBahamianBangladeshiBarbadianBasqueBelgianBelizeanBermudanBhutaneseBlackfeetBolivianBrazilianBritishBritish West IndianBulgarianBurmeseCajunCambodianCanadianCape VerdeanCarpatho RusynCelticCentral AmericanCentral American IndianCherokeeCheyenneChickasawChileanChineseChippewaChoctawColombianColvilleComancheCosta RicanCreeCreekCroatianCrowCubanCypriotCzechCzechoslovakianDanishDelawareDominicanDutchDutch West IndianEastern EuropeanEcuadorianEgyptianEnglishEstonianEthiopianEuropeanFijianFilipinoFinnishFrenchFrench American IndianFrench CanadianGermanGerman RussianGhanaianGreekGuamanian/ChamorroGuatemalanGuyaneseHaitianHmongHonduranHopiHoumaHungarianIcelanderIndian (Asian)IndonesianInupiatIranianIraqiIrishIroquoisIsraeliItalianJamaicanJapaneseJordanianKenyanKiowaKoreanLaotianLatvianLebaneseLiberianLithuanianLumbeeLuxembourgerMacedonianMalaysianMalteseMarshalleseMenomineeMexicanMexican American IndianMongolianMoroccanNative HawaiianNavajoNepaleseNew ZealanderNicaraguanNigerianNorthern EuropeanNorwegianOkinawanOsageOttawaPaiutePakistaniPalestinianPanamanianParaguayanPennsylvania GermanPeruvianPimaPolishPortuguesePotawatomiPuebloPuerto RicanPuget Sound SalishRomanianRussianSalvadoranSamoanScandinavianScotch-IrishScottishSeminoleSenegaleseSerbianShoshoneSierra LeoneanSiouxSlavicSlovakSloveneSomaliSouth AfricanSouth AmericanSouth American IndianSoviet UnionSpaniardSpanishSpanish AmericanSpanish American IndianSri LankanSubsaharan AfricanSudaneseSwedishSwissSyrianTaiwaneseThaiTlingit-HaidaTohono O'OdhamTonganTrinidadian and TobagonianTsimshianTurkishU.S. Virgin IslanderUgandanUkrainianUruguayanUteVenezuelanVietnameseWelshWest IndianYakamaYaquiYugoslavianYumanYup'ikZimbabwean
Immigration
NonimmigrantsImmigrantsAfghanistanAfricaAlbaniaArgentinaArmeniaAsiaAustraliaAustriaBahamasBangladeshBarbadosBelarusBelgiumBelizeBoliviaBosnia and HerzegovinaBrazilBulgariaBurma/MyanmarCabo VerdeCambodiaCameroonCanadaCaribbeanCentral AmericaChileChinaColombiaCongoCosta RicaCroatiaCubaCzechoslovakiaDenmarkDominicaDominican RepublicEastern AfricaEastern AsiaEastern EuropeEcuadorEgyptEl SalvadorEnglandEritreaEthiopiaEuropeFijiFranceGermanyGhanaGreeceGrenadaGuatemalaGuyanaHaitiHondurasHong KongHungaryIndiaIndonesiaIranIraqIrelandIsraelItalyJamaicaJapanJordanKazakhstanKenyaKoreaKuwaitLaosLatin AmericaLatviaLebanonLiberiaLithuaniaMalaysiaMexicoMicronesiaMiddle AfricaMoldovaMoroccoNepalNetherlandsNicaraguaNigeriaNorth AmericaNorth MacedoniaNorthern AfricaNorthern EuropeNorwayOceaniaPakistanPanamaPeruPhilippinesPolandPortugalRomaniaRussiaSaudi ArabiaScotlandSenegalSerbiaSierra LeoneSingaporeSomaliaSouth AfricaSouth AmericaSouth Central AsiaSouth Eastern AsiaSouthern EuropeSpainSri LankaSt. Vincent and the GrenadinesSudanSwedenSwitzerlandSyriaTaiwanThailandTrinidad and TobagoTurkeyUgandaUkraineUruguayUzbekistanVenezuelaVietnamWest IndiesWestern AfricaWestern AsiaWestern EuropeYemenZaireZimbabweAzores
Native/Alaskan
Race
Ancestry
AfghanAfricanAlaska NativeAlaskan AthabascanAlbanianAleutAlsatianAmericanApacheArabArapahoArgentineanArmenianAssyrian/Chaldean/SyriacAustralianAustrianBahamianBangladeshiBarbadianBasqueBelgianBelizeanBermudanBhutaneseBlackfeetBolivianBrazilianBritishBritish West IndianBulgarianBurmeseCajunCambodianCanadianCape VerdeanCarpatho RusynCelticCentral AmericanCentral American IndianCherokeeCheyenneChickasawChileanChineseChippewaChoctawColombianColvilleComancheCosta RicanCreeCreekCroatianCrowCubanCypriotCzechCzechoslovakianDanishDelawareDominicanDutchDutch West IndianEastern EuropeanEcuadorianEgyptianEnglishEstonianEthiopianEuropeanFijianFilipinoFinnishFrenchFrench American IndianFrench CanadianGermanGerman RussianGhanaianGreekGuamanian/ChamorroGuatemalanGuyaneseHaitianHmongHonduranHopiHoumaHungarianIcelanderIndian (Asian)IndonesianInupiatIranianIraqiIrishIroquoisIsraeliItalianJamaicanJapaneseJordanianKenyanKiowaKoreanLaotianLatvianLebaneseLiberianLithuanianLumbeeLuxembourgerMacedonianMalaysianMalteseMarshalleseMenomineeMexicanMexican American IndianMongolianMoroccanNative HawaiianNavajoNepaleseNew ZealanderNicaraguanNigerianNorthern EuropeanNorwegianOkinawanOsageOttawaPaiutePakistaniPalestinianPanamanianParaguayanPennsylvania GermanPeruvianPimaPolishPortuguesePotawatomiPuebloPuerto RicanPuget Sound SalishRomanianRussianSalvadoranSamoanScandinavianScotch-IrishScottishSeminoleSenegaleseSerbianShoshoneSierra LeoneanSiouxSlavicSloveneSomaliSouth AfricanSouth AmericanSouth American IndianSoviet UnionSpaniardSpanishSpanish AmericanSpanish American IndianSri LankanSubsaharan AfricanSudaneseSwedishSwissSyrianTaiwaneseThaiTlingit-HaidaTohono O'OdhamTonganTrinidadian and TobagonianTsimshianTurkishU.S. Virgin IslanderUgandanUkrainianUruguayanUteVenezuelanVietnameseWelshWest IndianYakamaYaquiYugoslavianYumanYup'ikZimbabwean
Immigration
NonimmigrantsImmigrantsAfghanistanAfricaAlbaniaArgentinaArmeniaAsiaAustraliaAustriaBahamasBangladeshBarbadosBelarusBelgiumBelizeBoliviaBosnia and HerzegovinaBrazilBulgariaBurma/MyanmarCabo VerdeCambodiaCameroonCanadaCaribbeanCentral AmericaChileChinaColombiaCongoCosta RicaCroatiaCubaCzechoslovakiaDenmarkDominicaDominican RepublicEastern AfricaEastern AsiaEastern EuropeEcuadorEgyptEl SalvadorEnglandEritreaEthiopiaEuropeFijiFranceGermanyGhanaGreeceGrenadaGuatemalaGuyanaHaitiHondurasHong KongHungaryIndiaIndonesiaIranIraqIrelandIsraelItalyJamaicaJapanJordanKazakhstanKenyaKoreaKuwaitLaosLatin AmericaLatviaLebanonLiberiaLithuaniaMalaysiaMexicoMicronesiaMiddle AfricaMoldovaMoroccoNepalNetherlandsNicaraguaNigeriaNorth AmericaNorth MacedoniaNorthern AfricaNorthern EuropeNorwayOceaniaPakistanPanamaPeruPhilippinesPolandPortugalRomaniaRussiaSaudi ArabiaScotlandSenegalSerbiaSierra LeoneSingaporeSomaliaSouth AfricaSouth AmericaSouth Central AsiaSouth Eastern AsiaSouthern EuropeSpainSri LankaSt. Vincent and the GrenadinesSudanSwedenSwitzerlandSyriaTaiwanThailandTrinidad and TobagoTurkeyUgandaUkraineUruguayUzbekistanVenezuelaVietnamWest IndiesWestern AfricaWestern AsiaWestern EuropeYemenZaireZimbabweAzores
In Labor Force | Age 20-64
Income
Poverty
Unemployment
Labor Participation
Family Structure
Vehicle Availability
Education Level
Disability

In Labor Force | Age 20-64 Comparison

Slovaks

Natives/Alaskans

Good
Tragic
79.8%
IN LABOR FORCE | AGE 20-64
79.9/ 100
METRIC RATING
142nd/ 347
METRIC RANK
73.9%
IN LABOR FORCE | AGE 20-64
0.0/ 100
METRIC RATING
333rd/ 347
METRIC RANK

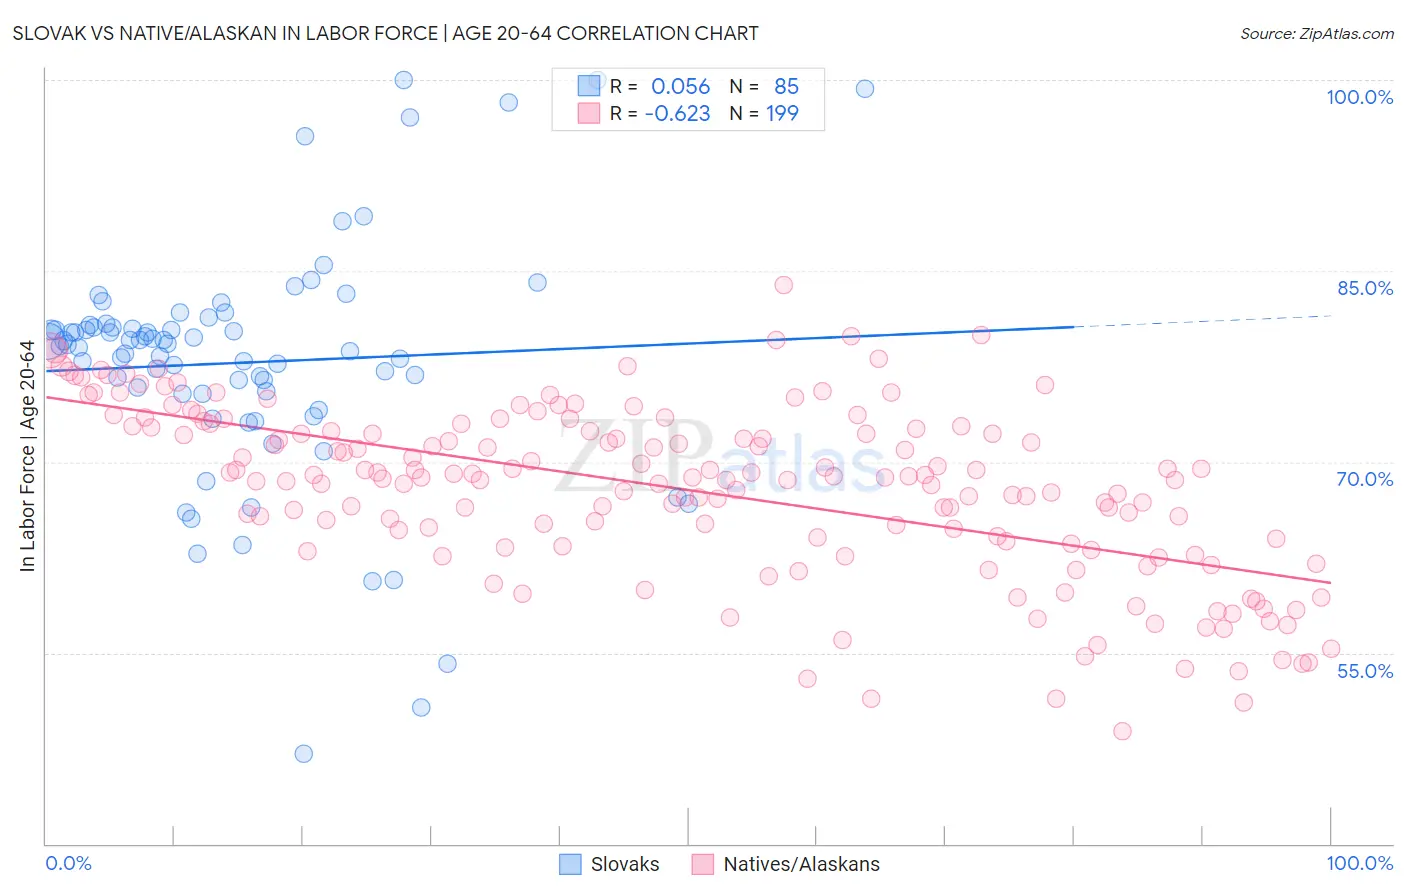
Slovak vs Native/Alaskan In Labor Force | Age 20-64 Correlation Chart

The statistical analysis conducted on geographies consisting of 397,893,595 people shows a slight positive correlation between the proportion of Slovaks and labor force participation rate among population between the ages 20 and 64 in the United States with a correlation coefficient (R) of 0.056 and weighted average of 79.8%. Similarly, the statistical analysis conducted on geographies consisting of 513,028,645 people shows a significant negative correlation between the proportion of Natives/Alaskans and labor force participation rate among population between the ages 20 and 64 in the United States with a correlation coefficient (R) of -0.623 and weighted average of 73.9%, a difference of 8.0%.
Slovak vs Native/Alaskan In Labor Force | Age 20-64

In Labor Force | Age 20-64 Correlation Summary

MeasurementSlovakNative/Alaskan
Minimum47.1%48.8%
Maximum100.0%83.9%
Range52.9%35.1%
Mean77.8%67.8%
Median79.2%68.8%
Interquartile 25% (IQ1)75.3%63.6%
Interquartile 75% (IQ3)80.7%72.7%
Interquartile Range (IQR)5.4%9.2%
Standard Deviation (Sample)9.4%6.8%
Standard Deviation (Population)9.4%6.8%

Similar Demographics by In Labor Force | Age 20-64

Demographics Similar to Slovaks by In Labor Force | Age 20-64

In terms of in labor force | age 20-64, the demographic groups most similar to Slovaks are Immigrants from Israel (79.8%, a difference of 0.0%), Immigrants from Sweden (79.8%, a difference of 0.0%), Korean (79.8%, a difference of 0.0%), Immigrants from South Eastern Asia (79.8%, a difference of 0.010%), and Pakistani (79.8%, a difference of 0.010%).
DemographicsRating | RankIn Labor Force | Age 20-64
Ukrainians
86.8
/100
|
#135
Excellent
79.9%
Immigrants | Singapore
86.7
/100
|
#136
Excellent
79.9%
Immigrants | Ukraine
86.5
/100
|
#137
Excellent
79.9%
Immigrants | Nigeria
86.4
/100
|
#138
Excellent
79.9%
Immigrants | Spain
83.9
/100
|
#139
Excellent
79.8%
Immigrants | South Eastern Asia
80.4
/100
|
#140
Excellent
79.8%
Immigrants | Israel
80.0
/100
|
#141
Good
79.8%
Slovaks
79.9
/100
|
#142
Good
79.8%
Immigrants | Sweden
79.7
/100
|
#143
Good
79.8%
Koreans
79.6
/100
|
#144
Good
79.8%
Pakistanis
79.3
/100
|
#145
Good
79.8%
Immigrants | Southern Europe
78.9
/100
|
#146
Good
79.8%
Immigrants | Philippines
78.0
/100
|
#147
Good
79.8%
Romanians
77.6
/100
|
#148
Good
79.8%
Icelanders
75.1
/100
|
#149
Good
79.7%

Demographics Similar to Natives/Alaskans by In Labor Force | Age 20-64

In terms of in labor force | age 20-64, the demographic groups most similar to Natives/Alaskans are Apache (73.7%, a difference of 0.30%), Ute (73.7%, a difference of 0.32%), Arapaho (74.4%, a difference of 0.66%), Crow (73.3%, a difference of 0.83%), and Yup'ik (73.2%, a difference of 0.95%).
DemographicsRating | RankIn Labor Force | Age 20-64
Creek
0.0
/100
|
#326
Tragic
75.1%
Sioux
0.0
/100
|
#327
Tragic
75.0%
Kiowa
0.0
/100
|
#328
Tragic
75.0%
Cheyenne
0.0
/100
|
#329
Tragic
74.8%
Colville
0.0
/100
|
#330
Tragic
74.8%
Paiute
0.0
/100
|
#331
Tragic
74.7%
Arapaho
0.0
/100
|
#332
Tragic
74.4%
Natives/Alaskans
0.0
/100
|
#333
Tragic
73.9%
Apache
0.0
/100
|
#334
Tragic
73.7%
Ute
0.0
/100
|
#335
Tragic
73.7%
Crow
0.0
/100
|
#336
Tragic
73.3%
Yup'ik
0.0
/100
|
#337
Tragic
73.2%
Puerto Ricans
0.0
/100
|
#338
Tragic
73.1%
Houma
0.0
/100
|
#339
Tragic
72.7%
Pueblo
0.0
/100
|
#340
Tragic
72.6%