Chinese vs Immigrants from Africa In Labor Force | Age > 16
COMPARE
Chinese
Immigrants from Africa
In Labor Force | Age > 16
In Labor Force | Age > 16 Comparison
Chinese
Immigrants from Africa
64.7%
IN LABOR FORCE | AGE > 16
7.3/ 100
METRIC RATING
230th/ 347
METRIC RANK
67.4%
IN LABOR FORCE | AGE > 16
100.0/ 100
METRIC RATING
25th/ 347
METRIC RANK
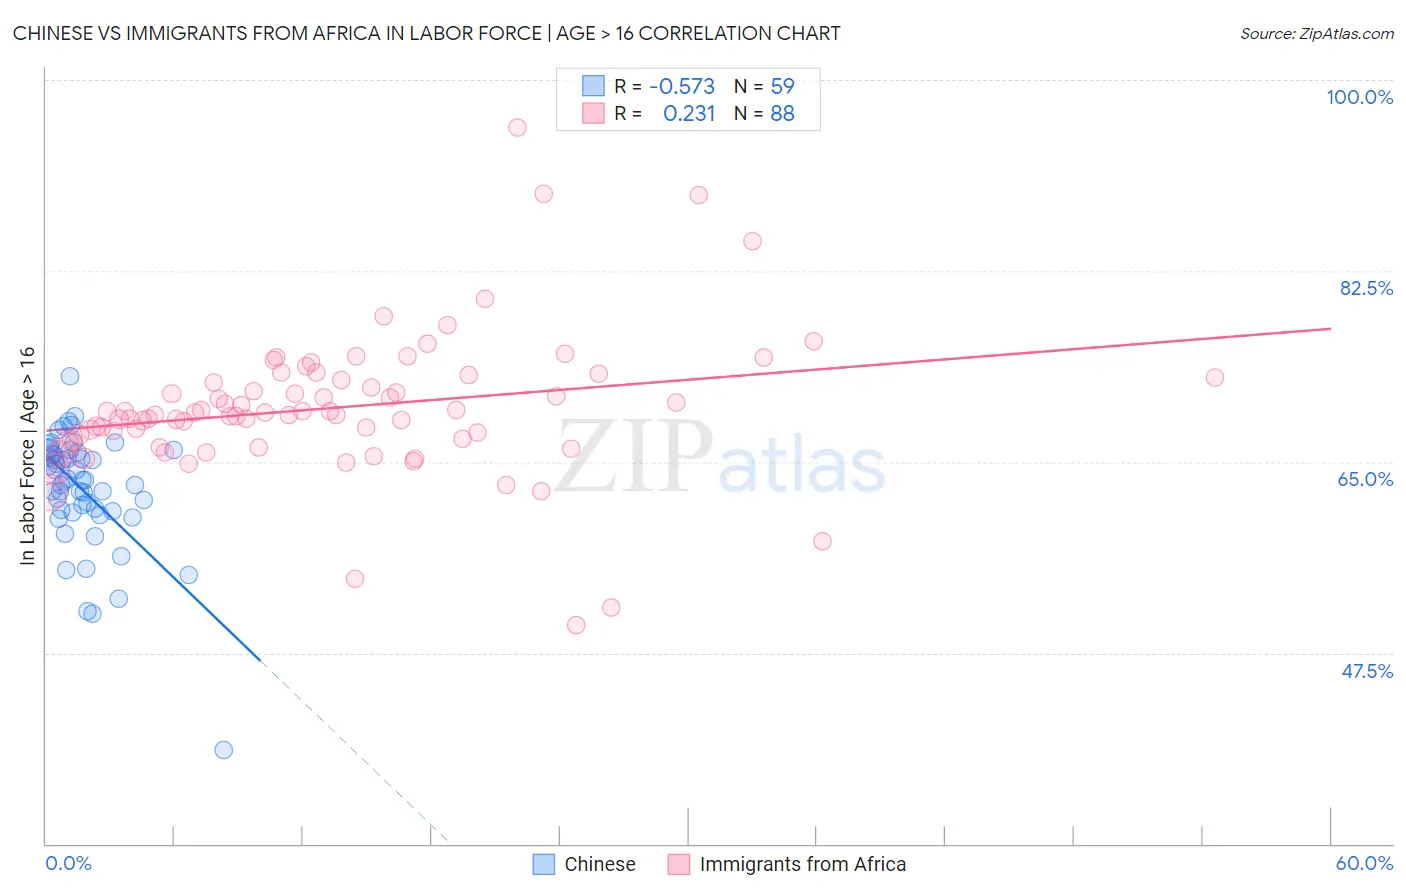
Chinese vs Immigrants from Africa In Labor Force | Age > 16 Correlation Chart
The statistical analysis conducted on geographies consisting of 64,809,883 people shows a substantial negative correlation between the proportion of Chinese and labor force participation rate among population ages 16 and over in the United States with a correlation coefficient (R) of -0.573 and weighted average of 64.7%. Similarly, the statistical analysis conducted on geographies consisting of 469,450,082 people shows a weak positive correlation between the proportion of Immigrants from Africa and labor force participation rate among population ages 16 and over in the United States with a correlation coefficient (R) of 0.231 and weighted average of 67.4%, a difference of 4.2%.
In Labor Force | Age > 16 Correlation Summary
| Measurement | Chinese | Immigrants from Africa |
| Minimum | 38.6% | 50.0% |
| Maximum | 72.9% | 95.6% |
| Range | 34.3% | 45.6% |
| Mean | 62.4% | 70.0% |
| Median | 63.3% | 69.4% |
| Interquartile 25% (IQ1) | 60.5% | 67.0% |
| Interquartile 75% (IQ3) | 65.9% | 72.6% |
| Interquartile Range (IQR) | 5.4% | 5.5% |
| Standard Deviation (Sample) | 5.4% | 6.6% |
| Standard Deviation (Population) | 5.4% | 6.6% |
Similar Demographics by In Labor Force | Age > 16
Demographics Similar to Chinese by In Labor Force | Age > 16
In terms of in labor force | age > 16, the demographic groups most similar to Chinese are British (64.7%, a difference of 0.0%), Immigrants from Northern Europe (64.7%, a difference of 0.0%), European (64.7%, a difference of 0.040%), Polish (64.7%, a difference of 0.040%), and Northern European (64.7%, a difference of 0.040%).
| Demographics | Rating | Rank | In Labor Force | Age > 16 |
| Immigrants | Belize | 9.2 /100 | #223 | Tragic 64.7% |
| Immigrants | Jamaica | 8.8 /100 | #224 | Tragic 64.7% |
| Croatians | 8.8 /100 | #225 | Tragic 64.7% |
| Europeans | 8.3 /100 | #226 | Tragic 64.7% |
| Poles | 8.3 /100 | #227 | Tragic 64.7% |
| Northern Europeans | 8.2 /100 | #228 | Tragic 64.7% |
| British | 7.3 /100 | #229 | Tragic 64.7% |
| Chinese | 7.3 /100 | #230 | Tragic 64.7% |
| Immigrants | Northern Europe | 7.2 /100 | #231 | Tragic 64.7% |
| Africans | 5.8 /100 | #232 | Tragic 64.6% |
| Slavs | 4.9 /100 | #233 | Tragic 64.6% |
| Vietnamese | 4.7 /100 | #234 | Tragic 64.6% |
| Austrians | 4.6 /100 | #235 | Tragic 64.6% |
| Immigrants | Norway | 4.6 /100 | #236 | Tragic 64.6% |
| Italians | 4.6 /100 | #237 | Tragic 64.6% |
Demographics Similar to Immigrants from Africa by In Labor Force | Age > 16
In terms of in labor force | age > 16, the demographic groups most similar to Immigrants from Africa are Ugandan (67.4%, a difference of 0.030%), Immigrants from Cabo Verde (67.3%, a difference of 0.030%), Cambodian (67.4%, a difference of 0.090%), Zimbabwean (67.3%, a difference of 0.11%), and Immigrants from Morocco (67.2%, a difference of 0.19%).
| Demographics | Rating | Rank | In Labor Force | Age > 16 |
| Immigrants | Liberia | 100.0 /100 | #18 | Exceptional 67.6% |
| Kenyans | 100.0 /100 | #19 | Exceptional 67.6% |
| Immigrants | Kenya | 100.0 /100 | #20 | Exceptional 67.6% |
| Tongans | 100.0 /100 | #21 | Exceptional 67.5% |
| Immigrants | Uganda | 100.0 /100 | #22 | Exceptional 67.5% |
| Cambodians | 100.0 /100 | #23 | Exceptional 67.4% |
| Ugandans | 100.0 /100 | #24 | Exceptional 67.4% |
| Immigrants | Africa | 100.0 /100 | #25 | Exceptional 67.4% |
| Immigrants | Cabo Verde | 100.0 /100 | #26 | Exceptional 67.3% |
| Zimbabweans | 100.0 /100 | #27 | Exceptional 67.3% |
| Immigrants | Morocco | 100.0 /100 | #28 | Exceptional 67.2% |
| Thais | 100.0 /100 | #29 | Exceptional 67.2% |
| Immigrants | Zaire | 100.0 /100 | #30 | Exceptional 67.2% |
| Ghanaians | 100.0 /100 | #31 | Exceptional 67.1% |
| Immigrants | Congo | 100.0 /100 | #32 | Exceptional 67.1% |