Chinese vs Immigrants from Africa Male Poverty
COMPARE
Chinese
Immigrants from Africa
Male Poverty
Male Poverty Comparison
Chinese
Immigrants from Africa
8.7%
MALE POVERTY
100.0/ 100
METRIC RATING
2nd/ 347
METRIC RANK
12.2%
MALE POVERTY
2.1/ 100
METRIC RATING
222nd/ 347
METRIC RANK
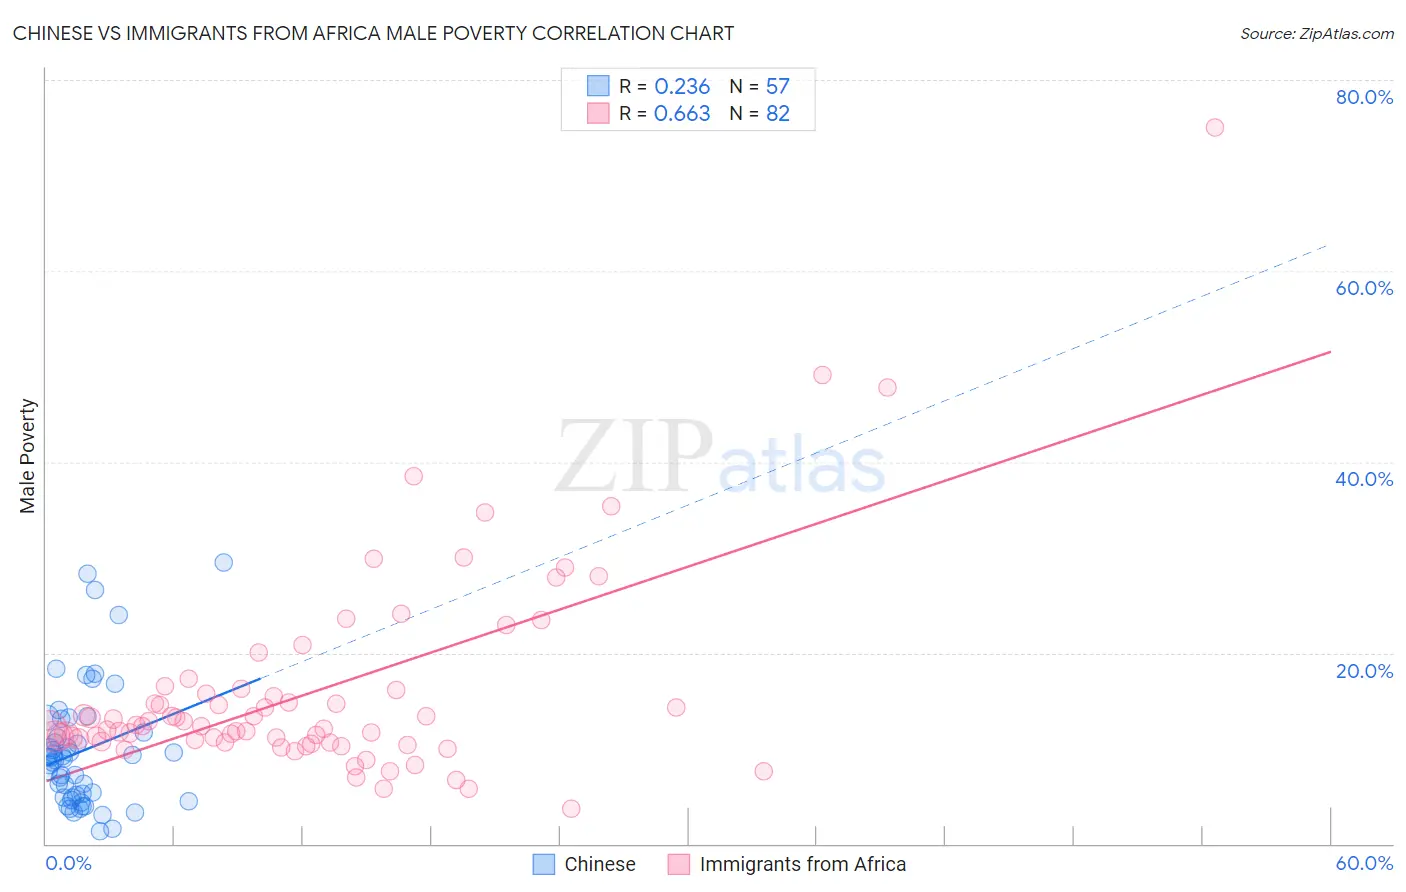
Chinese vs Immigrants from Africa Male Poverty Correlation Chart
The statistical analysis conducted on geographies consisting of 64,801,112 people shows a weak positive correlation between the proportion of Chinese and poverty level among males in the United States with a correlation coefficient (R) of 0.236 and weighted average of 8.7%. Similarly, the statistical analysis conducted on geographies consisting of 468,698,192 people shows a significant positive correlation between the proportion of Immigrants from Africa and poverty level among males in the United States with a correlation coefficient (R) of 0.663 and weighted average of 12.2%, a difference of 40.9%.
Male Poverty Correlation Summary
| Measurement | Chinese | Immigrants from Africa |
| Minimum | 1.3% | 3.7% |
| Maximum | 29.4% | 75.0% |
| Range | 28.2% | 71.3% |
| Mean | 9.7% | 16.0% |
| Median | 8.9% | 12.3% |
| Interquartile 25% (IQ1) | 4.8% | 10.7% |
| Interquartile 75% (IQ3) | 12.4% | 16.1% |
| Interquartile Range (IQR) | 7.6% | 5.4% |
| Standard Deviation (Sample) | 6.4% | 10.9% |
| Standard Deviation (Population) | 6.4% | 10.9% |
Similar Demographics by Male Poverty
Demographics Similar to Chinese by Male Poverty
In terms of male poverty, the demographic groups most similar to Chinese are Thai (8.7%, a difference of 0.080%), Immigrants from Taiwan (8.9%, a difference of 2.4%), Maltese (9.1%, a difference of 4.4%), Assyrian/Chaldean/Syriac (9.1%, a difference of 5.1%), and Immigrants from Ireland (9.1%, a difference of 5.2%).
| Demographics | Rating | Rank | Male Poverty |
| Immigrants | India | 100.0 /100 | #1 | Exceptional 8.2% |
| Chinese | 100.0 /100 | #2 | Exceptional 8.7% |
| Thais | 100.0 /100 | #3 | Exceptional 8.7% |
| Immigrants | Taiwan | 100.0 /100 | #4 | Exceptional 8.9% |
| Maltese | 100.0 /100 | #5 | Exceptional 9.1% |
| Assyrians/Chaldeans/Syriacs | 99.9 /100 | #6 | Exceptional 9.1% |
| Immigrants | Ireland | 99.9 /100 | #7 | Exceptional 9.1% |
| Filipinos | 99.9 /100 | #8 | Exceptional 9.2% |
| Immigrants | South Central Asia | 99.9 /100 | #9 | Exceptional 9.3% |
| Bulgarians | 99.9 /100 | #10 | Exceptional 9.3% |
| Bolivians | 99.9 /100 | #11 | Exceptional 9.4% |
| Immigrants | Bolivia | 99.9 /100 | #12 | Exceptional 9.4% |
| Immigrants | Lithuania | 99.9 /100 | #13 | Exceptional 9.4% |
| Immigrants | North Macedonia | 99.8 /100 | #14 | Exceptional 9.4% |
| Bhutanese | 99.8 /100 | #15 | Exceptional 9.5% |
Demographics Similar to Immigrants from Africa by Male Poverty
In terms of male poverty, the demographic groups most similar to Immigrants from Africa are Immigrants from Micronesia (12.2%, a difference of 0.010%), Ugandan (12.2%, a difference of 0.020%), Immigrants from Eritrea (12.2%, a difference of 0.23%), Bermudan (12.2%, a difference of 0.25%), and German Russian (12.2%, a difference of 0.32%).
| Demographics | Rating | Rank | Male Poverty |
| Immigrants | Uzbekistan | 2.6 /100 | #215 | Tragic 12.2% |
| Immigrants | Cambodia | 2.5 /100 | #216 | Tragic 12.2% |
| Immigrants | Thailand | 2.5 /100 | #217 | Tragic 12.2% |
| German Russians | 2.5 /100 | #218 | Tragic 12.2% |
| Bermudans | 2.4 /100 | #219 | Tragic 12.2% |
| Immigrants | Eritrea | 2.4 /100 | #220 | Tragic 12.2% |
| Ugandans | 2.2 /100 | #221 | Tragic 12.2% |
| Immigrants | Africa | 2.1 /100 | #222 | Tragic 12.2% |
| Immigrants | Micronesia | 2.1 /100 | #223 | Tragic 12.2% |
| Immigrants | Nigeria | 1.6 /100 | #224 | Tragic 12.3% |
| Osage | 1.5 /100 | #225 | Tragic 12.3% |
| Nigerians | 1.4 /100 | #226 | Tragic 12.3% |
| Alaska Natives | 1.4 /100 | #227 | Tragic 12.4% |
| Alsatians | 1.3 /100 | #228 | Tragic 12.4% |
| Cubans | 1.3 /100 | #229 | Tragic 12.4% |