Chinese vs Immigrants from Africa Unemployment Among Ages 30 to 34 years
COMPARE
Chinese
Immigrants from Africa
Unemployment Among Ages 30 to 34 years
Unemployment Among Ages 30 to 34 years Comparison
Chinese
Immigrants from Africa
5.1%
UNEMPLOYMENT AMONG AGES 30 TO 34 YEARS
97.7/ 100
METRIC RATING
55th/ 347
METRIC RANK
5.5%
UNEMPLOYMENT AMONG AGES 30 TO 34 YEARS
31.0/ 100
METRIC RATING
193rd/ 347
METRIC RANK
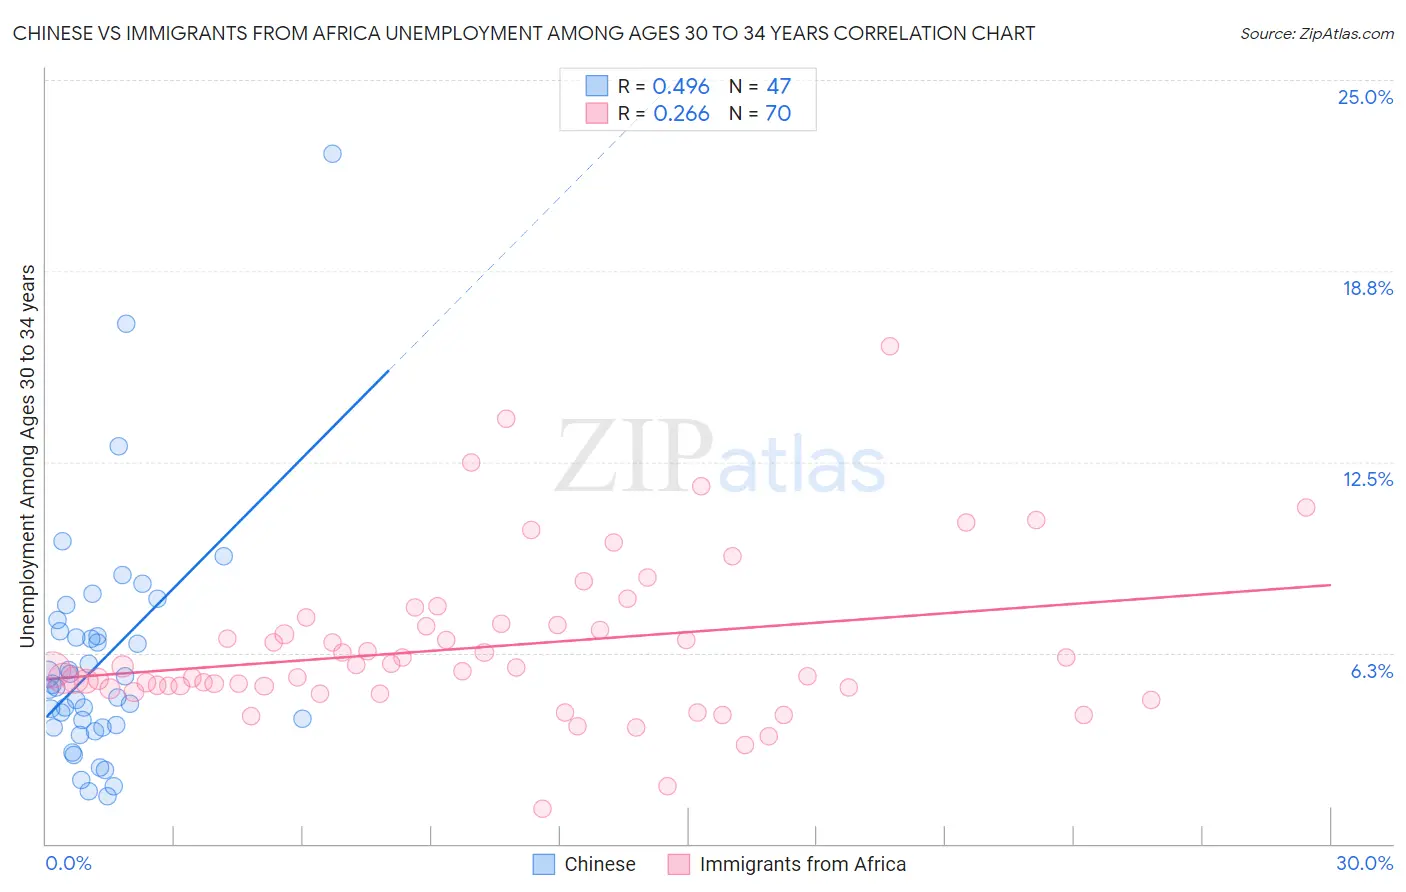
Chinese vs Immigrants from Africa Unemployment Among Ages 30 to 34 years Correlation Chart
The statistical analysis conducted on geographies consisting of 64,021,968 people shows a moderate positive correlation between the proportion of Chinese and unemployment rate among population between the ages 30 and 34 in the United States with a correlation coefficient (R) of 0.496 and weighted average of 5.1%. Similarly, the statistical analysis conducted on geographies consisting of 436,875,352 people shows a weak positive correlation between the proportion of Immigrants from Africa and unemployment rate among population between the ages 30 and 34 in the United States with a correlation coefficient (R) of 0.266 and weighted average of 5.5%, a difference of 8.4%.
Unemployment Among Ages 30 to 34 years Correlation Summary
| Measurement | Chinese | Immigrants from Africa |
| Minimum | 1.5% | 1.2% |
| Maximum | 22.6% | 16.3% |
| Range | 21.1% | 15.1% |
| Mean | 6.0% | 6.4% |
| Median | 5.1% | 5.7% |
| Interquartile 25% (IQ1) | 3.8% | 5.1% |
| Interquartile 75% (IQ3) | 7.0% | 7.2% |
| Interquartile Range (IQR) | 3.2% | 2.1% |
| Standard Deviation (Sample) | 3.8% | 2.6% |
| Standard Deviation (Population) | 3.8% | 2.6% |
Similar Demographics by Unemployment Among Ages 30 to 34 years
Demographics Similar to Chinese by Unemployment Among Ages 30 to 34 years
In terms of unemployment among ages 30 to 34 years, the demographic groups most similar to Chinese are Immigrants from Serbia (5.1%, a difference of 0.19%), Immigrants from Morocco (5.1%, a difference of 0.20%), Immigrants from China (5.1%, a difference of 0.33%), Asian (5.1%, a difference of 0.34%), and Cuban (5.1%, a difference of 0.38%).
| Demographics | Rating | Rank | Unemployment Among Ages 30 to 34 years |
| Assyrians/Chaldeans/Syriacs | 98.4 /100 | #48 | Exceptional 5.1% |
| Immigrants | Malaysia | 98.3 /100 | #49 | Exceptional 5.1% |
| Puget Sound Salish | 98.2 /100 | #50 | Exceptional 5.1% |
| Turks | 98.2 /100 | #51 | Exceptional 5.1% |
| Immigrants | Burma/Myanmar | 98.1 /100 | #52 | Exceptional 5.1% |
| Cubans | 98.1 /100 | #53 | Exceptional 5.1% |
| Immigrants | Morocco | 97.9 /100 | #54 | Exceptional 5.1% |
| Chinese | 97.7 /100 | #55 | Exceptional 5.1% |
| Immigrants | Serbia | 97.4 /100 | #56 | Exceptional 5.1% |
| Immigrants | China | 97.2 /100 | #57 | Exceptional 5.1% |
| Asians | 97.2 /100 | #58 | Exceptional 5.1% |
| Swedes | 97.1 /100 | #59 | Exceptional 5.1% |
| Immigrants | Somalia | 97.1 /100 | #60 | Exceptional 5.1% |
| Indians (Asian) | 97.0 /100 | #61 | Exceptional 5.1% |
| Immigrants | France | 97.0 /100 | #62 | Exceptional 5.1% |
Demographics Similar to Immigrants from Africa by Unemployment Among Ages 30 to 34 years
In terms of unemployment among ages 30 to 34 years, the demographic groups most similar to Immigrants from Africa are Irish (5.5%, a difference of 0.020%), Moroccan (5.5%, a difference of 0.020%), Slavic (5.5%, a difference of 0.020%), Finnish (5.5%, a difference of 0.030%), and Immigrants from South America (5.5%, a difference of 0.10%).
| Demographics | Rating | Rank | Unemployment Among Ages 30 to 34 years |
| Canadians | 38.2 /100 | #186 | Fair 5.5% |
| Immigrants | Western Asia | 38.2 /100 | #187 | Fair 5.5% |
| Immigrants | Norway | 36.1 /100 | #188 | Fair 5.5% |
| Immigrants | England | 35.7 /100 | #189 | Fair 5.5% |
| Immigrants | Kazakhstan | 33.9 /100 | #190 | Fair 5.5% |
| Irish | 31.3 /100 | #191 | Fair 5.5% |
| Moroccans | 31.2 /100 | #192 | Fair 5.5% |
| Immigrants | Africa | 31.0 /100 | #193 | Fair 5.5% |
| Slavs | 30.9 /100 | #194 | Fair 5.5% |
| Finns | 30.7 /100 | #195 | Fair 5.5% |
| Immigrants | South America | 29.8 /100 | #196 | Fair 5.5% |
| Immigrants | Nicaragua | 28.9 /100 | #197 | Fair 5.5% |
| Immigrants | Afghanistan | 27.2 /100 | #198 | Fair 5.6% |
| Nicaraguans | 26.6 /100 | #199 | Fair 5.6% |
| Immigrants | Southern Europe | 25.8 /100 | #200 | Fair 5.6% |