Tlingit-Haida vs Samoan In Labor Force | Age 45-54
COMPARE
Tlingit-Haida
Samoan
In Labor Force | Age 45-54
In Labor Force | Age 45-54 Comparison
Tlingit-Haida
Samoans
83.9%
IN LABOR FORCE | AGE 45-54
99.8/ 100
METRIC RATING
23rd/ 347
METRIC RANK
81.8%
IN LABOR FORCE | AGE 45-54
0.6/ 100
METRIC RATING
243rd/ 347
METRIC RANK
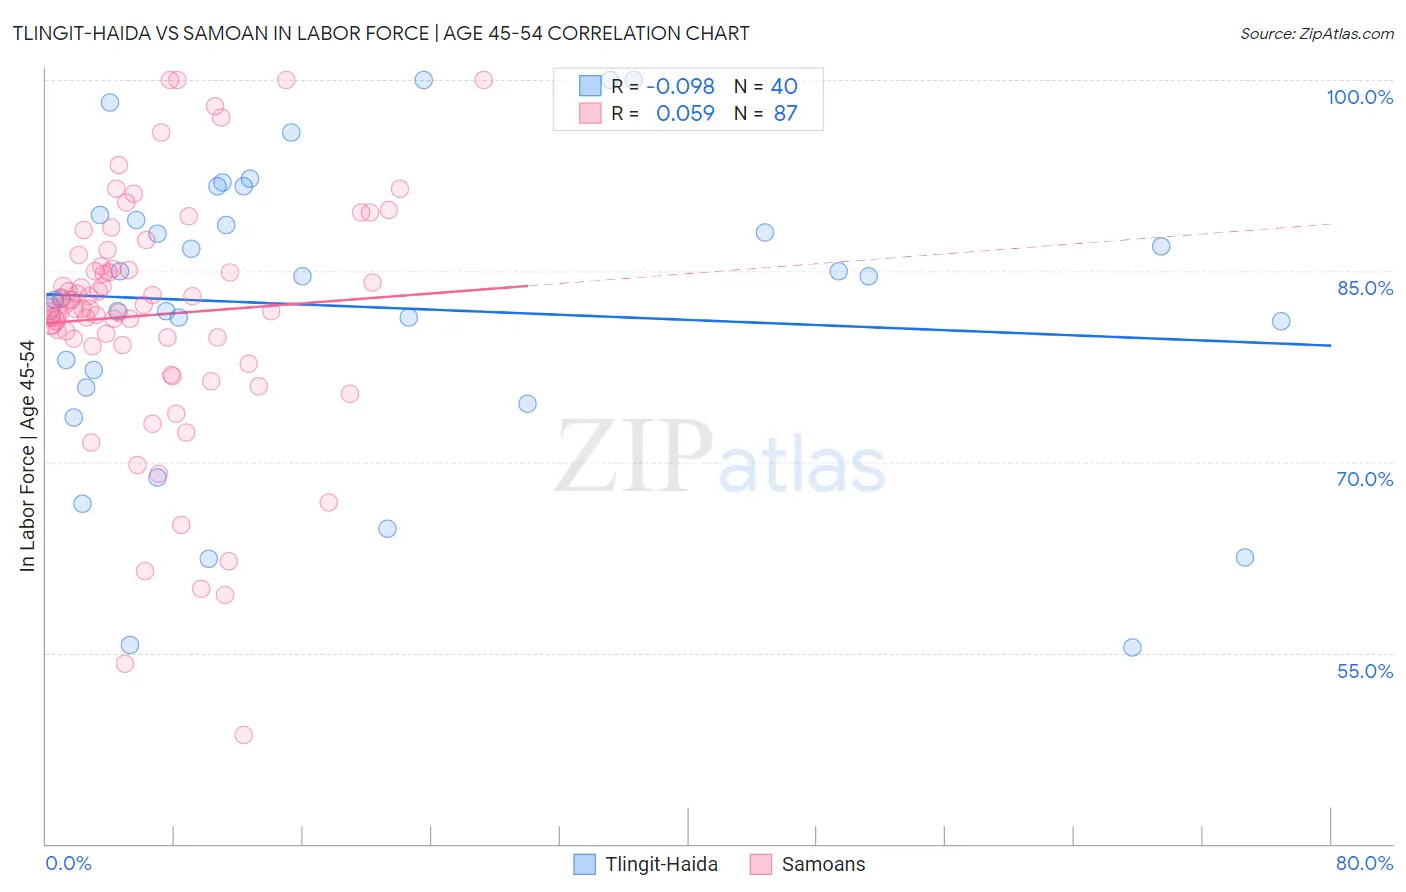
Tlingit-Haida vs Samoan In Labor Force | Age 45-54 Correlation Chart
The statistical analysis conducted on geographies consisting of 60,861,176 people shows a slight negative correlation between the proportion of Tlingit-Haida and labor force participation rate among population between the ages 45 and 54 in the United States with a correlation coefficient (R) of -0.098 and weighted average of 83.9%. Similarly, the statistical analysis conducted on geographies consisting of 225,090,886 people shows a slight positive correlation between the proportion of Samoans and labor force participation rate among population between the ages 45 and 54 in the United States with a correlation coefficient (R) of 0.059 and weighted average of 81.8%, a difference of 2.5%.
In Labor Force | Age 45-54 Correlation Summary
| Measurement | Tlingit-Haida | Samoan |
| Minimum | 55.4% | 48.5% |
| Maximum | 100.0% | 100.0% |
| Range | 44.6% | 51.5% |
| Mean | 82.2% | 81.6% |
| Median | 83.7% | 82.1% |
| Interquartile 25% (IQ1) | 76.5% | 79.2% |
| Interquartile 75% (IQ3) | 89.2% | 85.4% |
| Interquartile Range (IQR) | 12.7% | 6.1% |
| Standard Deviation (Sample) | 11.5% | 9.7% |
| Standard Deviation (Population) | 11.4% | 9.6% |
Similar Demographics by In Labor Force | Age 45-54
Demographics Similar to Tlingit-Haida by In Labor Force | Age 45-54
In terms of in labor force | age 45-54, the demographic groups most similar to Tlingit-Haida are Immigrants from Ireland (83.9%, a difference of 0.0%), Immigrants from Eastern Africa (83.9%, a difference of 0.010%), Immigrants from Sri Lanka (83.9%, a difference of 0.010%), Slovene (83.9%, a difference of 0.010%), and Czech (83.9%, a difference of 0.020%).
| Demographics | Rating | Rank | In Labor Force | Age 45-54 |
| Immigrants | Nepal | 99.9 /100 | #16 | Exceptional 84.0% |
| Zimbabweans | 99.9 /100 | #17 | Exceptional 84.0% |
| Immigrants | South Central Asia | 99.9 /100 | #18 | Exceptional 84.0% |
| Czechs | 99.8 /100 | #19 | Exceptional 83.9% |
| Immigrants | Eastern Africa | 99.8 /100 | #20 | Exceptional 83.9% |
| Immigrants | Sri Lanka | 99.8 /100 | #21 | Exceptional 83.9% |
| Immigrants | Ireland | 99.8 /100 | #22 | Exceptional 83.9% |
| Tlingit-Haida | 99.8 /100 | #23 | Exceptional 83.9% |
| Slovenes | 99.8 /100 | #24 | Exceptional 83.9% |
| Immigrants | North Macedonia | 99.8 /100 | #25 | Exceptional 83.9% |
| Immigrants | Serbia | 99.8 /100 | #26 | Exceptional 83.9% |
| Immigrants | Brazil | 99.8 /100 | #27 | Exceptional 83.9% |
| Immigrants | Lithuania | 99.8 /100 | #28 | Exceptional 83.9% |
| Immigrants | Pakistan | 99.7 /100 | #29 | Exceptional 83.8% |
| Immigrants | Bulgaria | 99.7 /100 | #30 | Exceptional 83.8% |
Demographics Similar to Samoans by In Labor Force | Age 45-54
In terms of in labor force | age 45-54, the demographic groups most similar to Samoans are White/Caucasian (81.9%, a difference of 0.010%), Immigrants from Cambodia (81.9%, a difference of 0.050%), Immigrants from El Salvador (81.9%, a difference of 0.090%), Celtic (81.8%, a difference of 0.090%), and Immigrants from Thailand (81.9%, a difference of 0.10%).
| Demographics | Rating | Rank | In Labor Force | Age 45-54 |
| Basques | 1.2 /100 | #236 | Tragic 82.0% |
| Immigrants | Trinidad and Tobago | 1.2 /100 | #237 | Tragic 82.0% |
| Trinidadians and Tobagonians | 1.1 /100 | #238 | Tragic 81.9% |
| Immigrants | Thailand | 1.0 /100 | #239 | Tragic 81.9% |
| Immigrants | El Salvador | 1.0 /100 | #240 | Tragic 81.9% |
| Immigrants | Cambodia | 0.8 /100 | #241 | Tragic 81.9% |
| Whites/Caucasians | 0.7 /100 | #242 | Tragic 81.9% |
| Samoans | 0.6 /100 | #243 | Tragic 81.8% |
| Celtics | 0.4 /100 | #244 | Tragic 81.8% |
| Alaska Natives | 0.4 /100 | #245 | Tragic 81.8% |
| Alaskan Athabascans | 0.4 /100 | #246 | Tragic 81.8% |
| Central Americans | 0.4 /100 | #247 | Tragic 81.7% |
| Puget Sound Salish | 0.3 /100 | #248 | Tragic 81.7% |
| Hmong | 0.3 /100 | #249 | Tragic 81.7% |
| Immigrants | Armenia | 0.2 /100 | #250 | Tragic 81.7% |