Immigrants from China vs Samoan In Labor Force | Age 45-54
COMPARE
Immigrants from China
Samoan
In Labor Force | Age 45-54
In Labor Force | Age 45-54 Comparison
Immigrants from China
Samoans
83.2%
IN LABOR FORCE | AGE 45-54
90.9/ 100
METRIC RATING
117th/ 347
METRIC RANK
81.8%
IN LABOR FORCE | AGE 45-54
0.6/ 100
METRIC RATING
243rd/ 347
METRIC RANK
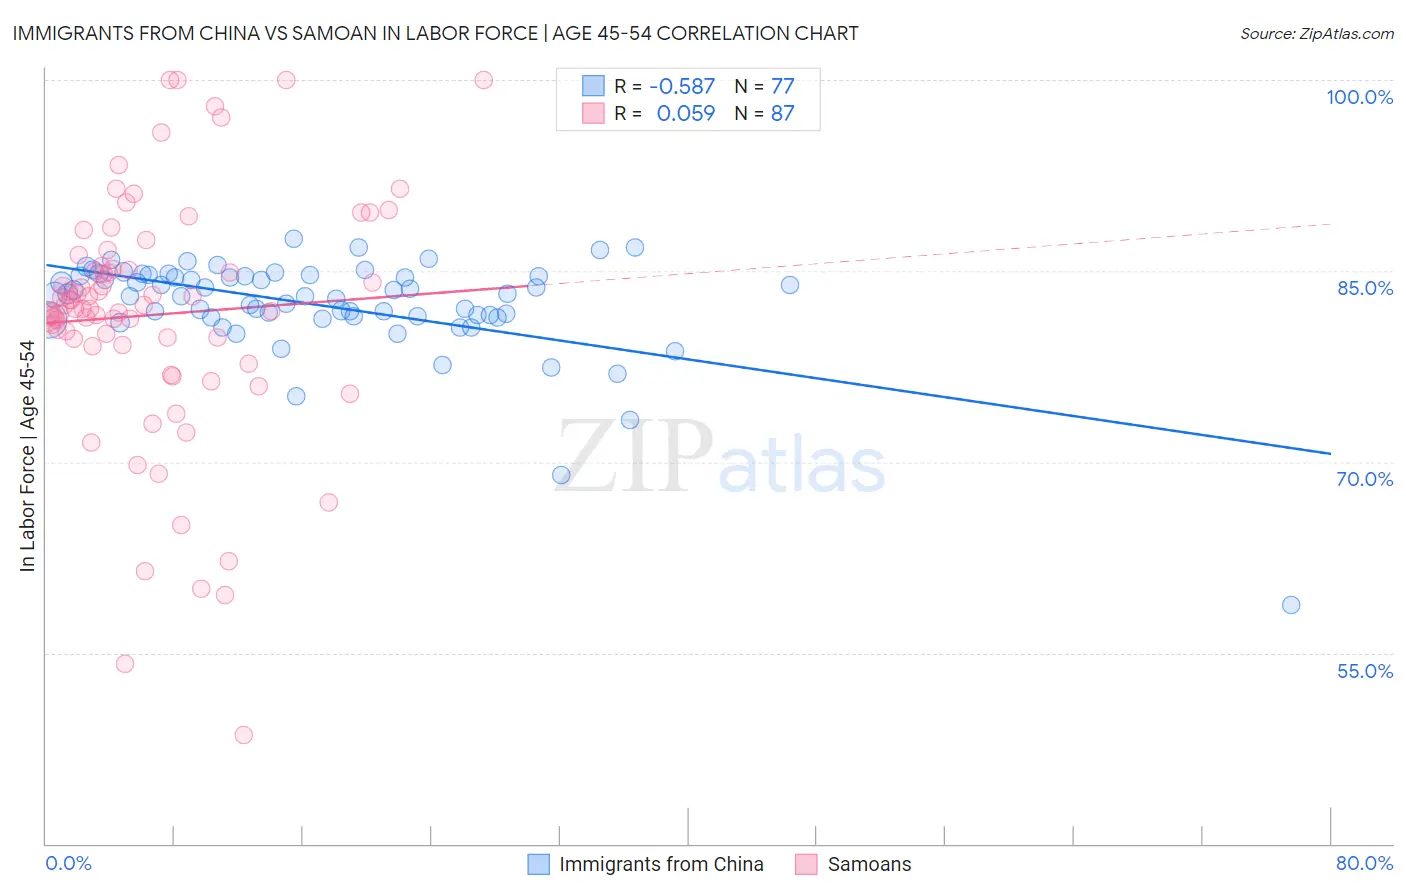
Immigrants from China vs Samoan In Labor Force | Age 45-54 Correlation Chart
The statistical analysis conducted on geographies consisting of 456,555,548 people shows a substantial negative correlation between the proportion of Immigrants from China and labor force participation rate among population between the ages 45 and 54 in the United States with a correlation coefficient (R) of -0.587 and weighted average of 83.2%. Similarly, the statistical analysis conducted on geographies consisting of 225,090,886 people shows a slight positive correlation between the proportion of Samoans and labor force participation rate among population between the ages 45 and 54 in the United States with a correlation coefficient (R) of 0.059 and weighted average of 81.8%, a difference of 1.6%.
In Labor Force | Age 45-54 Correlation Summary
| Measurement | Immigrants from China | Samoan |
| Minimum | 58.8% | 48.5% |
| Maximum | 87.5% | 100.0% |
| Range | 28.7% | 51.5% |
| Mean | 82.3% | 81.6% |
| Median | 83.1% | 82.1% |
| Interquartile 25% (IQ1) | 81.4% | 79.2% |
| Interquartile 75% (IQ3) | 84.6% | 85.4% |
| Interquartile Range (IQR) | 3.3% | 6.1% |
| Standard Deviation (Sample) | 4.1% | 9.7% |
| Standard Deviation (Population) | 4.0% | 9.6% |
Similar Demographics by In Labor Force | Age 45-54
Demographics Similar to Immigrants from China by In Labor Force | Age 45-54
In terms of in labor force | age 45-54, the demographic groups most similar to Immigrants from China are Immigrants from Malaysia (83.2%, a difference of 0.010%), Immigrants from Europe (83.2%, a difference of 0.010%), Assyrian/Chaldean/Syriac (83.2%, a difference of 0.020%), Immigrants from Chile (83.2%, a difference of 0.020%), and Immigrants from Uruguay (83.2%, a difference of 0.020%).
| Demographics | Rating | Rank | In Labor Force | Age 45-54 |
| Immigrants | Africa | 92.6 /100 | #110 | Exceptional 83.2% |
| Immigrants | Italy | 92.5 /100 | #111 | Exceptional 83.2% |
| Immigrants | Afghanistan | 92.4 /100 | #112 | Exceptional 83.2% |
| Immigrants | Albania | 91.8 /100 | #113 | Exceptional 83.2% |
| Assyrians/Chaldeans/Syriacs | 91.7 /100 | #114 | Exceptional 83.2% |
| Immigrants | Chile | 91.6 /100 | #115 | Exceptional 83.2% |
| Immigrants | Malaysia | 91.4 /100 | #116 | Exceptional 83.2% |
| Immigrants | China | 90.9 /100 | #117 | Exceptional 83.2% |
| Immigrants | Europe | 90.7 /100 | #118 | Exceptional 83.2% |
| Immigrants | Uruguay | 90.2 /100 | #119 | Exceptional 83.2% |
| Immigrants | Russia | 90.1 /100 | #120 | Exceptional 83.2% |
| Uruguayans | 89.4 /100 | #121 | Excellent 83.1% |
| Immigrants | Vietnam | 88.9 /100 | #122 | Excellent 83.1% |
| Tongans | 88.2 /100 | #123 | Excellent 83.1% |
| Bermudans | 88.0 /100 | #124 | Excellent 83.1% |
Demographics Similar to Samoans by In Labor Force | Age 45-54
In terms of in labor force | age 45-54, the demographic groups most similar to Samoans are White/Caucasian (81.9%, a difference of 0.010%), Immigrants from Cambodia (81.9%, a difference of 0.050%), Immigrants from El Salvador (81.9%, a difference of 0.090%), Celtic (81.8%, a difference of 0.090%), and Immigrants from Thailand (81.9%, a difference of 0.10%).
| Demographics | Rating | Rank | In Labor Force | Age 45-54 |
| Basques | 1.2 /100 | #236 | Tragic 82.0% |
| Immigrants | Trinidad and Tobago | 1.2 /100 | #237 | Tragic 82.0% |
| Trinidadians and Tobagonians | 1.1 /100 | #238 | Tragic 81.9% |
| Immigrants | Thailand | 1.0 /100 | #239 | Tragic 81.9% |
| Immigrants | El Salvador | 1.0 /100 | #240 | Tragic 81.9% |
| Immigrants | Cambodia | 0.8 /100 | #241 | Tragic 81.9% |
| Whites/Caucasians | 0.7 /100 | #242 | Tragic 81.9% |
| Samoans | 0.6 /100 | #243 | Tragic 81.8% |
| Celtics | 0.4 /100 | #244 | Tragic 81.8% |
| Alaska Natives | 0.4 /100 | #245 | Tragic 81.8% |
| Alaskan Athabascans | 0.4 /100 | #246 | Tragic 81.8% |
| Central Americans | 0.4 /100 | #247 | Tragic 81.7% |
| Puget Sound Salish | 0.3 /100 | #248 | Tragic 81.7% |
| Hmong | 0.3 /100 | #249 | Tragic 81.7% |
| Immigrants | Armenia | 0.2 /100 | #250 | Tragic 81.7% |