Immigrants from Oceania vs Samoan In Labor Force | Age 45-54
COMPARE
Immigrants from Oceania
Samoan
In Labor Force | Age 45-54
In Labor Force | Age 45-54 Comparison
Immigrants from Oceania
Samoans
82.1%
IN LABOR FORCE | AGE 45-54
2.5/ 100
METRIC RATING
225th/ 347
METRIC RANK
81.8%
IN LABOR FORCE | AGE 45-54
0.6/ 100
METRIC RATING
243rd/ 347
METRIC RANK
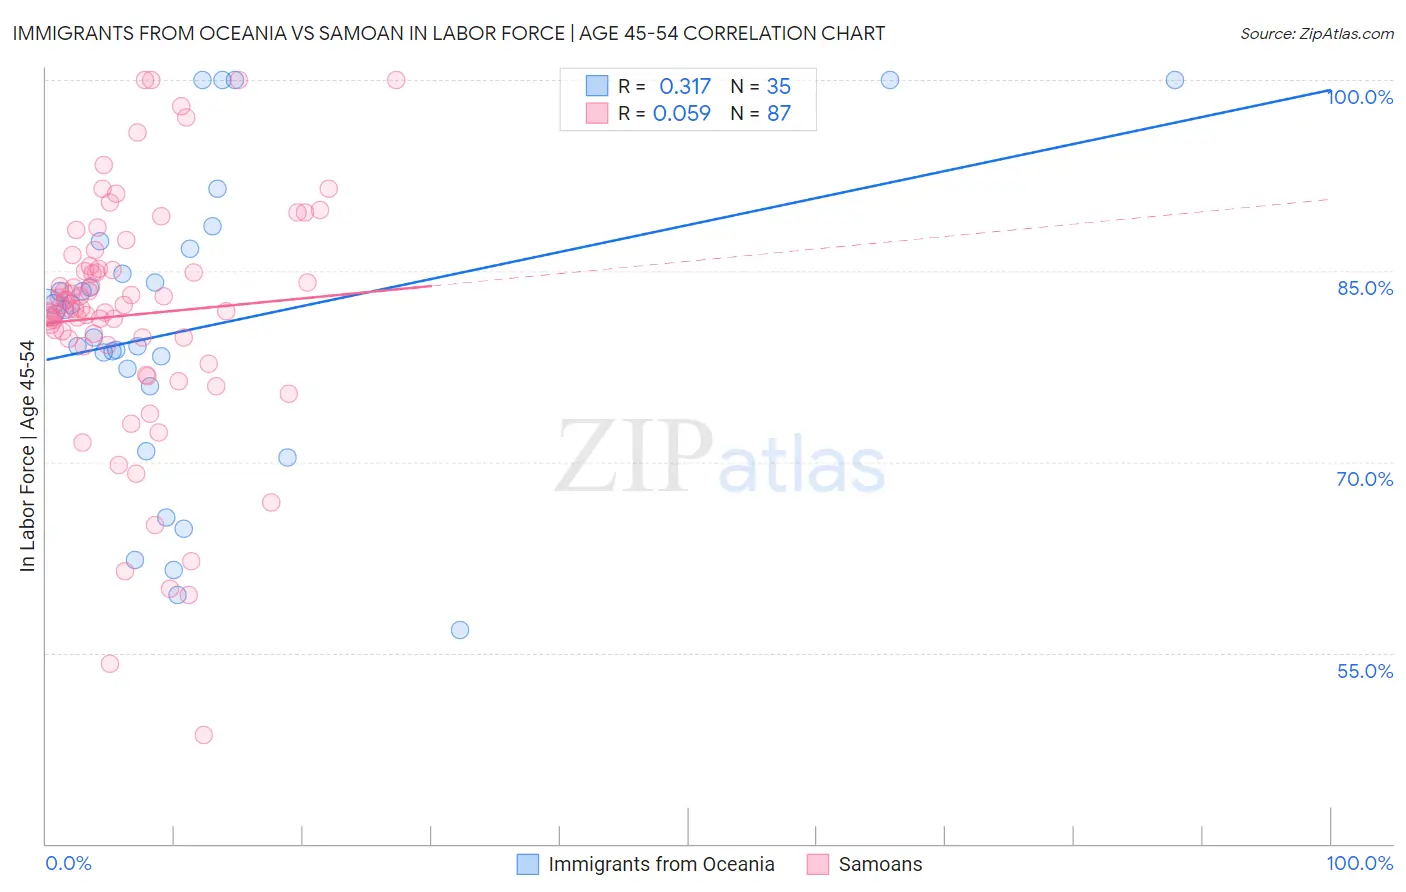
Immigrants from Oceania vs Samoan In Labor Force | Age 45-54 Correlation Chart
The statistical analysis conducted on geographies consisting of 305,368,221 people shows a mild positive correlation between the proportion of Immigrants from Oceania and labor force participation rate among population between the ages 45 and 54 in the United States with a correlation coefficient (R) of 0.317 and weighted average of 82.1%. Similarly, the statistical analysis conducted on geographies consisting of 225,090,886 people shows a slight positive correlation between the proportion of Samoans and labor force participation rate among population between the ages 45 and 54 in the United States with a correlation coefficient (R) of 0.059 and weighted average of 81.8%, a difference of 0.30%.
In Labor Force | Age 45-54 Correlation Summary
| Measurement | Immigrants from Oceania | Samoan |
| Minimum | 56.8% | 48.5% |
| Maximum | 100.0% | 100.0% |
| Range | 43.2% | 51.5% |
| Mean | 80.6% | 81.6% |
| Median | 82.0% | 82.1% |
| Interquartile 25% (IQ1) | 75.9% | 79.2% |
| Interquartile 75% (IQ3) | 86.7% | 85.4% |
| Interquartile Range (IQR) | 10.8% | 6.1% |
| Standard Deviation (Sample) | 11.7% | 9.7% |
| Standard Deviation (Population) | 11.5% | 9.6% |
Demographics Similar to Immigrants from Oceania and Samoans by In Labor Force | Age 45-54
In terms of in labor force | age 45-54, the demographic groups most similar to Immigrants from Oceania are Immigrants from Caribbean (82.1%, a difference of 0.0%), Immigrants from Germany (82.1%, a difference of 0.010%), Immigrants from Jamaica (82.1%, a difference of 0.020%), Cape Verdean (82.1%, a difference of 0.040%), and Immigrants from Burma/Myanmar (82.0%, a difference of 0.060%). Similarly, the demographic groups most similar to Samoans are White/Caucasian (81.9%, a difference of 0.010%), Immigrants from Cambodia (81.9%, a difference of 0.050%), Immigrants from El Salvador (81.9%, a difference of 0.090%), Celtic (81.8%, a difference of 0.090%), and Immigrants from Thailand (81.9%, a difference of 0.10%).
| Demographics | Rating | Rank | In Labor Force | Age 45-54 |
| Immigrants | Jamaica | 2.7 /100 | #224 | Tragic 82.1% |
| Immigrants | Oceania | 2.5 /100 | #225 | Tragic 82.1% |
| Immigrants | Caribbean | 2.5 /100 | #226 | Tragic 82.1% |
| Immigrants | Germany | 2.4 /100 | #227 | Tragic 82.1% |
| Cape Verdeans | 2.1 /100 | #228 | Tragic 82.1% |
| Immigrants | Burma/Myanmar | 1.9 /100 | #229 | Tragic 82.0% |
| Jamaicans | 1.8 /100 | #230 | Tragic 82.0% |
| Immigrants | Senegal | 1.7 /100 | #231 | Tragic 82.0% |
| Immigrants | Portugal | 1.7 /100 | #232 | Tragic 82.0% |
| Malaysians | 1.7 /100 | #233 | Tragic 82.0% |
| Salvadorans | 1.7 /100 | #234 | Tragic 82.0% |
| Sub-Saharan Africans | 1.2 /100 | #235 | Tragic 82.0% |
| Basques | 1.2 /100 | #236 | Tragic 82.0% |
| Immigrants | Trinidad and Tobago | 1.2 /100 | #237 | Tragic 82.0% |
| Trinidadians and Tobagonians | 1.1 /100 | #238 | Tragic 81.9% |
| Immigrants | Thailand | 1.0 /100 | #239 | Tragic 81.9% |
| Immigrants | El Salvador | 1.0 /100 | #240 | Tragic 81.9% |
| Immigrants | Cambodia | 0.8 /100 | #241 | Tragic 81.9% |
| Whites/Caucasians | 0.7 /100 | #242 | Tragic 81.9% |
| Samoans | 0.6 /100 | #243 | Tragic 81.8% |
| Celtics | 0.4 /100 | #244 | Tragic 81.8% |