Chickasaw vs Immigrants from Caribbean Median Earnings
COMPARE
Chickasaw
Immigrants from Caribbean
Median Earnings
Median Earnings Comparison
Chickasaw
Immigrants from Caribbean
$40,672
MEDIAN EARNINGS
0.0/ 100
METRIC RATING
305th/ 347
METRIC RANK
$41,119
MEDIAN EARNINGS
0.1/ 100
METRIC RATING
299th/ 347
METRIC RANK
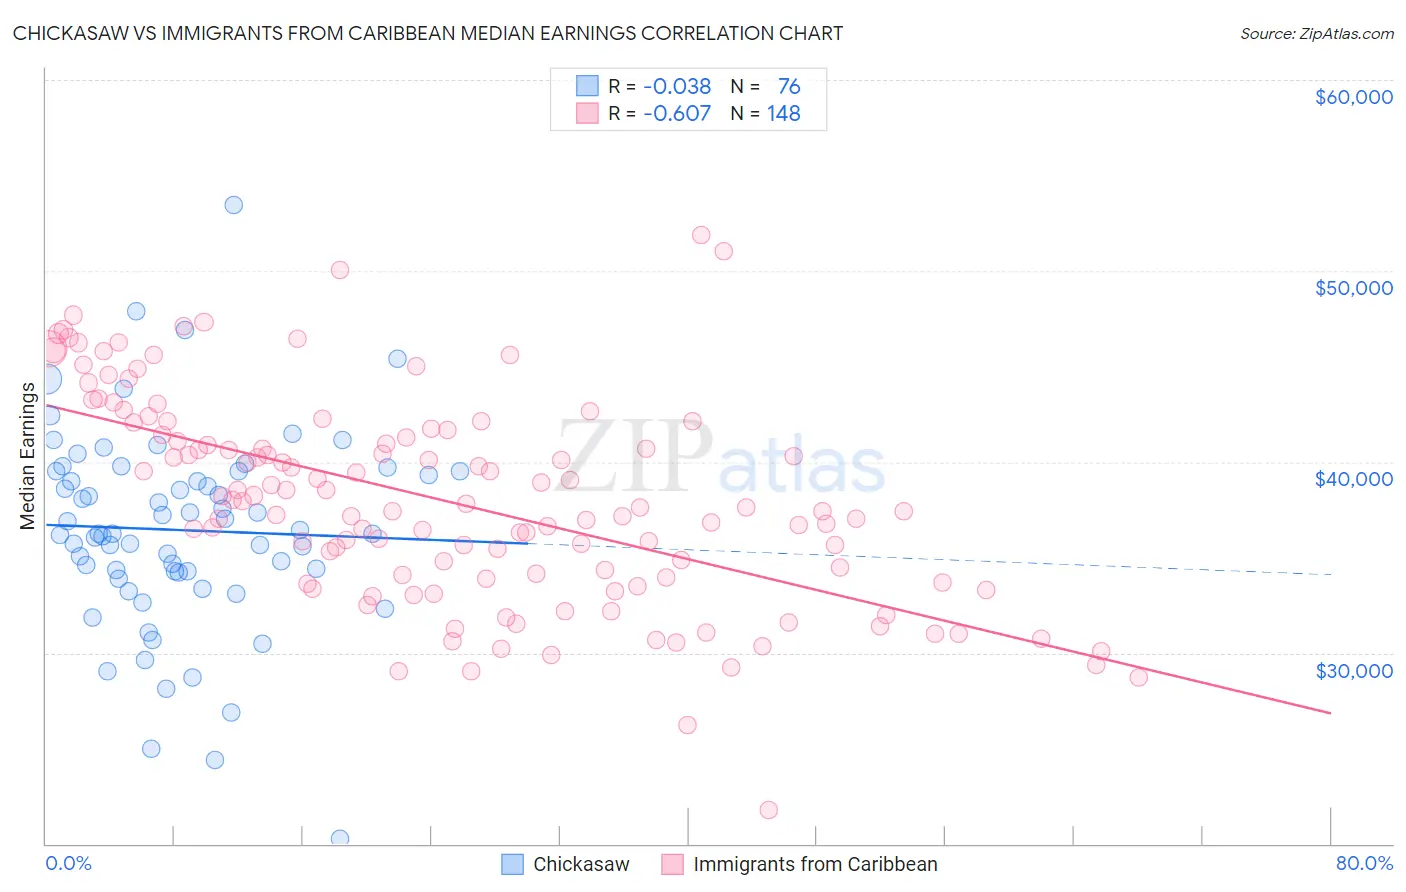
Chickasaw vs Immigrants from Caribbean Median Earnings Correlation Chart
The statistical analysis conducted on geographies consisting of 147,718,191 people shows no correlation between the proportion of Chickasaw and median earnings in the United States with a correlation coefficient (R) of -0.038 and weighted average of $40,672. Similarly, the statistical analysis conducted on geographies consisting of 450,013,484 people shows a significant negative correlation between the proportion of Immigrants from Caribbean and median earnings in the United States with a correlation coefficient (R) of -0.607 and weighted average of $41,119, a difference of 1.1%.
Median Earnings Correlation Summary
| Measurement | Chickasaw | Immigrants from Caribbean |
| Minimum | $20,250 | $21,741 |
| Maximum | $53,432 | $51,911 |
| Range | $33,182 | $30,170 |
| Mean | $36,428 | $37,958 |
| Median | $36,238 | $37,629 |
| Interquartile 25% (IQ1) | $34,220 | $33,921 |
| Interquartile 75% (IQ3) | $39,491 | $41,541 |
| Interquartile Range (IQR) | $5,270 | $7,620 |
| Standard Deviation (Sample) | $5,289 | $5,439 |
| Standard Deviation (Population) | $5,254 | $5,421 |
Demographics Similar to Chickasaw and Immigrants from Caribbean by Median Earnings
In terms of median earnings, the demographic groups most similar to Chickasaw are Yaqui ($40,647, a difference of 0.060%), Honduran ($40,638, a difference of 0.080%), Cuban ($40,619, a difference of 0.13%), Immigrants from Haiti ($40,550, a difference of 0.30%), and Immigrants from Guatemala ($40,851, a difference of 0.44%). Similarly, the demographic groups most similar to Immigrants from Caribbean are Immigrants from Micronesia ($41,133, a difference of 0.030%), Ute ($41,051, a difference of 0.17%), Immigrants from Latin America ($41,049, a difference of 0.17%), Guatemalan ($41,205, a difference of 0.21%), and Cherokee ($41,252, a difference of 0.32%).
| Demographics | Rating | Rank | Median Earnings |
| U.S. Virgin Islanders | 0.1 /100 | #292 | Tragic $41,448 |
| Immigrants | Zaire | 0.1 /100 | #293 | Tragic $41,325 |
| Potawatomi | 0.1 /100 | #294 | Tragic $41,288 |
| Bangladeshis | 0.1 /100 | #295 | Tragic $41,263 |
| Cherokee | 0.1 /100 | #296 | Tragic $41,252 |
| Guatemalans | 0.1 /100 | #297 | Tragic $41,205 |
| Immigrants | Micronesia | 0.1 /100 | #298 | Tragic $41,133 |
| Immigrants | Caribbean | 0.1 /100 | #299 | Tragic $41,119 |
| Ute | 0.1 /100 | #300 | Tragic $41,051 |
| Immigrants | Latin America | 0.1 /100 | #301 | Tragic $41,049 |
| Shoshone | 0.0 /100 | #302 | Tragic $40,932 |
| Haitians | 0.0 /100 | #303 | Tragic $40,918 |
| Immigrants | Guatemala | 0.0 /100 | #304 | Tragic $40,851 |
| Chickasaw | 0.0 /100 | #305 | Tragic $40,672 |
| Yaqui | 0.0 /100 | #306 | Tragic $40,647 |
| Hondurans | 0.0 /100 | #307 | Tragic $40,638 |
| Cubans | 0.0 /100 | #308 | Tragic $40,619 |
| Immigrants | Haiti | 0.0 /100 | #309 | Tragic $40,550 |
| Apache | 0.0 /100 | #310 | Tragic $40,388 |
| Hispanics or Latinos | 0.0 /100 | #311 | Tragic $40,288 |
| Chippewa | 0.0 /100 | #312 | Tragic $40,287 |