Turkish vs Immigrants from Brazil In Labor Force | Age 35-44
COMPARE
Turkish
Immigrants from Brazil
In Labor Force | Age 35-44
In Labor Force | Age 35-44 Comparison
Turks
Immigrants from Brazil
85.1%
IN LABOR FORCE | AGE 35-44
99.5/ 100
METRIC RATING
54th/ 347
METRIC RANK
85.0%
IN LABOR FORCE | AGE 35-44
99.2/ 100
METRIC RATING
65th/ 347
METRIC RANK
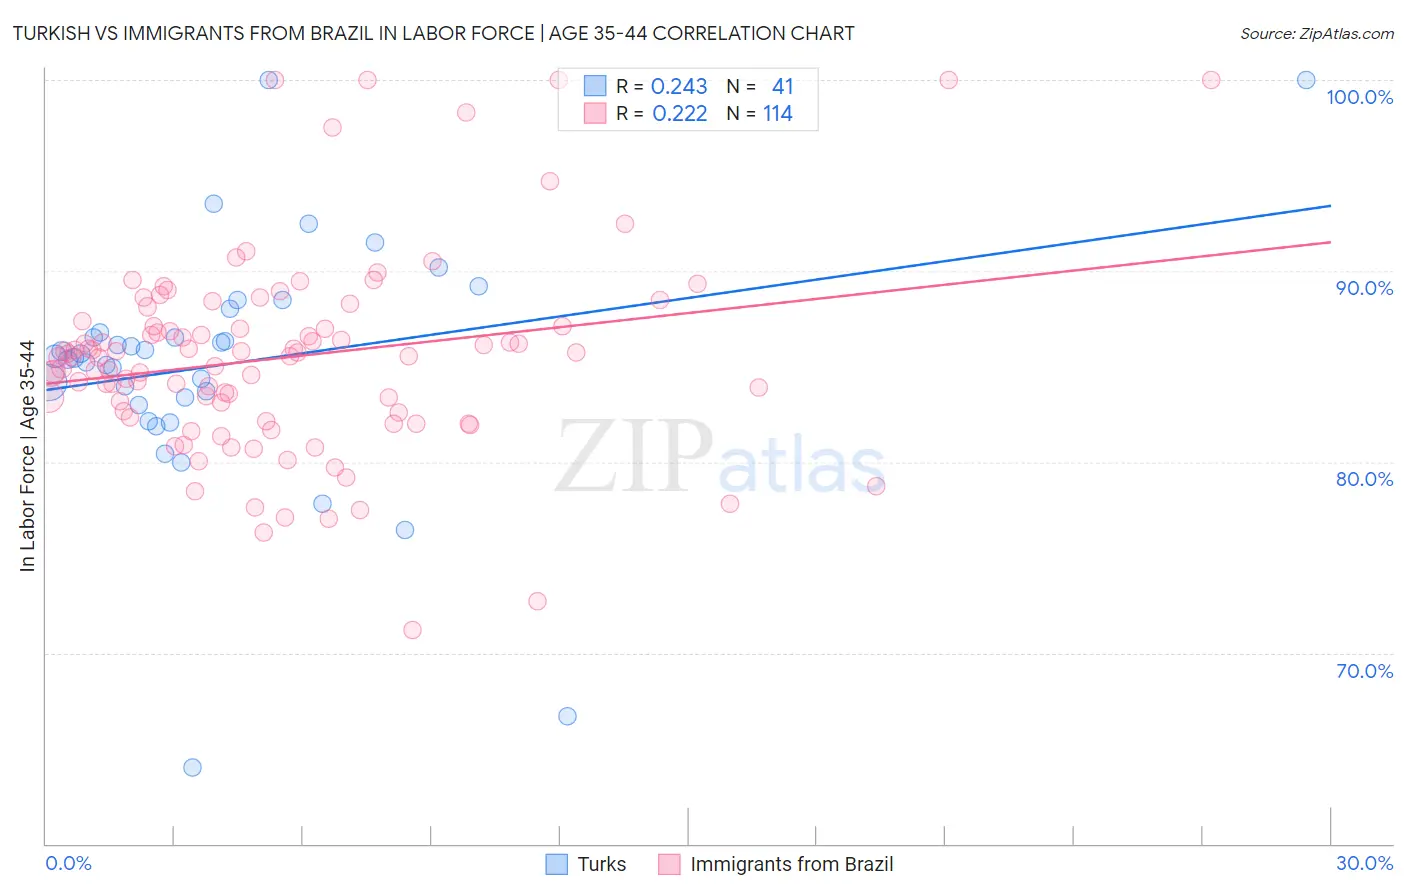
Turkish vs Immigrants from Brazil In Labor Force | Age 35-44 Correlation Chart
The statistical analysis conducted on geographies consisting of 271,726,396 people shows a weak positive correlation between the proportion of Turks and labor force participation rate among population between the ages 35 and 44 in the United States with a correlation coefficient (R) of 0.243 and weighted average of 85.1%. Similarly, the statistical analysis conducted on geographies consisting of 342,874,628 people shows a weak positive correlation between the proportion of Immigrants from Brazil and labor force participation rate among population between the ages 35 and 44 in the United States with a correlation coefficient (R) of 0.222 and weighted average of 85.0%, a difference of 0.090%.
In Labor Force | Age 35-44 Correlation Summary
| Measurement | Turkish | Immigrants from Brazil |
| Minimum | 64.0% | 71.2% |
| Maximum | 100.0% | 100.0% |
| Range | 36.0% | 28.8% |
| Mean | 85.1% | 85.5% |
| Median | 85.5% | 85.5% |
| Interquartile 25% (IQ1) | 83.2% | 82.6% |
| Interquartile 75% (IQ3) | 87.4% | 87.1% |
| Interquartile Range (IQR) | 4.2% | 4.5% |
| Standard Deviation (Sample) | 6.5% | 5.2% |
| Standard Deviation (Population) | 6.4% | 5.2% |
Demographics Similar to Turks and Immigrants from Brazil by In Labor Force | Age 35-44
In terms of in labor force | age 35-44, the demographic groups most similar to Turks are Soviet Union (85.1%, a difference of 0.0%), Immigrants from Croatia (85.1%, a difference of 0.010%), Taiwanese (85.1%, a difference of 0.020%), Immigrants from Kenya (85.1%, a difference of 0.030%), and Chinese (85.1%, a difference of 0.030%). Similarly, the demographic groups most similar to Immigrants from Brazil are Immigrants from Haiti (85.0%, a difference of 0.0%), Swedish (85.0%, a difference of 0.010%), Immigrants from Italy (85.0%, a difference of 0.010%), Immigrants from Moldova (85.0%, a difference of 0.020%), and Immigrants from Uganda (85.0%, a difference of 0.020%).
| Demographics | Rating | Rank | In Labor Force | Age 35-44 |
| Croatians | 99.7 /100 | #49 | Exceptional 85.2% |
| Thais | 99.7 /100 | #50 | Exceptional 85.2% |
| Immigrants | Albania | 99.7 /100 | #51 | Exceptional 85.1% |
| Immigrants | Kenya | 99.6 /100 | #52 | Exceptional 85.1% |
| Taiwanese | 99.6 /100 | #53 | Exceptional 85.1% |
| Turks | 99.5 /100 | #54 | Exceptional 85.1% |
| Soviet Union | 99.5 /100 | #55 | Exceptional 85.1% |
| Immigrants | Croatia | 99.5 /100 | #56 | Exceptional 85.1% |
| Chinese | 99.4 /100 | #57 | Exceptional 85.1% |
| Slovaks | 99.4 /100 | #58 | Exceptional 85.1% |
| Serbians | 99.4 /100 | #59 | Exceptional 85.1% |
| Albanians | 99.4 /100 | #60 | Exceptional 85.1% |
| Immigrants | Latvia | 99.3 /100 | #61 | Exceptional 85.0% |
| Immigrants | Moldova | 99.3 /100 | #62 | Exceptional 85.0% |
| Immigrants | Uganda | 99.3 /100 | #63 | Exceptional 85.0% |
| Swedes | 99.2 /100 | #64 | Exceptional 85.0% |
| Immigrants | Brazil | 99.2 /100 | #65 | Exceptional 85.0% |
| Immigrants | Haiti | 99.1 /100 | #66 | Exceptional 85.0% |
| Immigrants | Italy | 99.1 /100 | #67 | Exceptional 85.0% |
| Italians | 99.1 /100 | #68 | Exceptional 85.0% |
| Sudanese | 99.0 /100 | #69 | Exceptional 85.0% |