Navajo vs Immigrants from Brazil In Labor Force | Age 35-44
COMPARE
Navajo
Immigrants from Brazil
In Labor Force | Age 35-44
In Labor Force | Age 35-44 Comparison
Navajo
Immigrants from Brazil
73.8%
IN LABOR FORCE | AGE 35-44
0.0/ 100
METRIC RATING
347th/ 347
METRIC RANK
85.0%
IN LABOR FORCE | AGE 35-44
99.2/ 100
METRIC RATING
65th/ 347
METRIC RANK
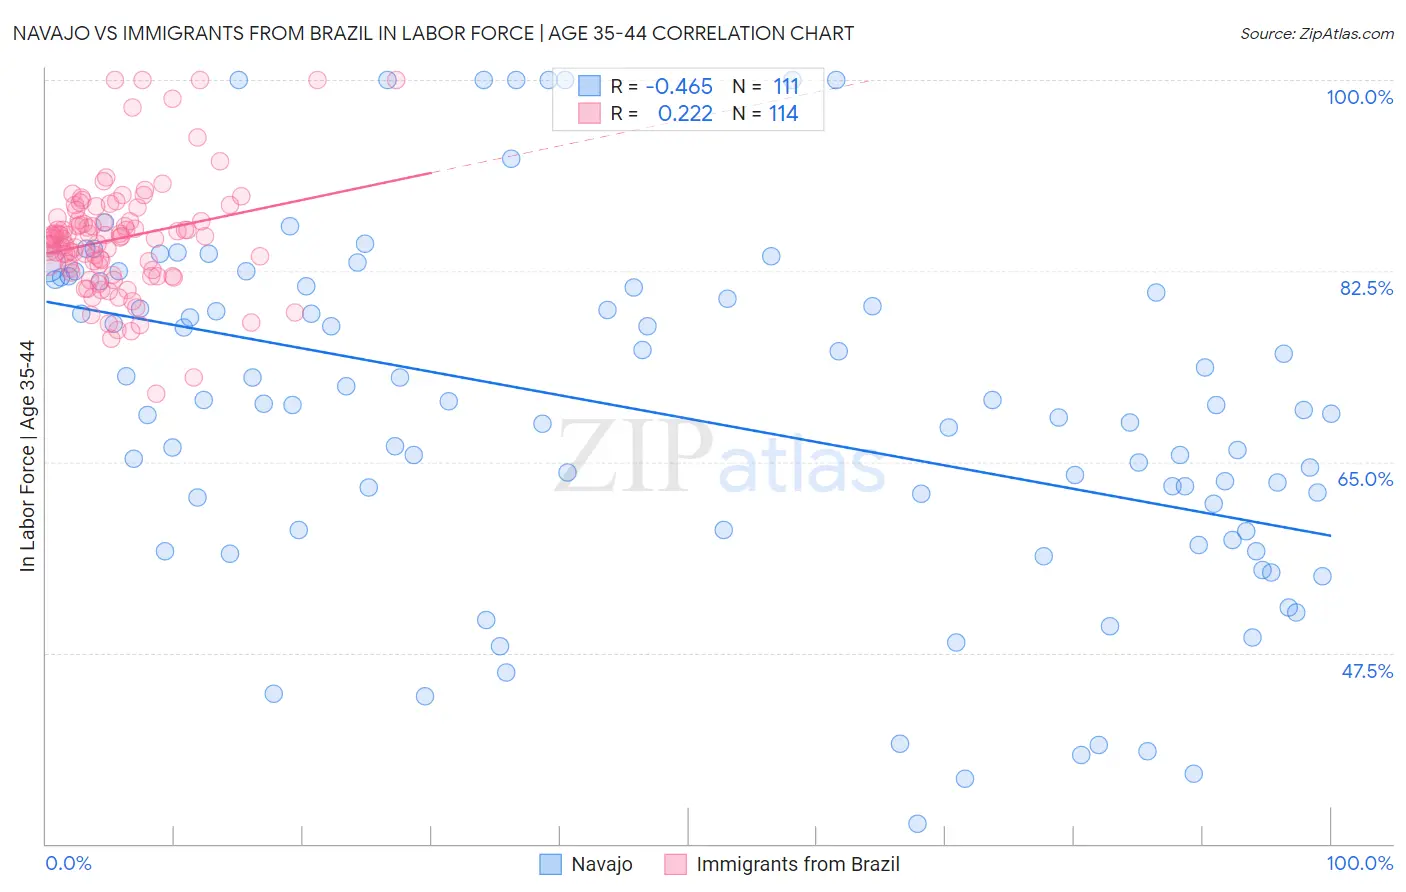
Navajo vs Immigrants from Brazil In Labor Force | Age 35-44 Correlation Chart
The statistical analysis conducted on geographies consisting of 224,798,006 people shows a moderate negative correlation between the proportion of Navajo and labor force participation rate among population between the ages 35 and 44 in the United States with a correlation coefficient (R) of -0.465 and weighted average of 73.8%. Similarly, the statistical analysis conducted on geographies consisting of 342,874,628 people shows a weak positive correlation between the proportion of Immigrants from Brazil and labor force participation rate among population between the ages 35 and 44 in the United States with a correlation coefficient (R) of 0.222 and weighted average of 85.0%, a difference of 15.1%.
In Labor Force | Age 35-44 Correlation Summary
| Measurement | Navajo | Immigrants from Brazil |
| Minimum | 31.8% | 71.2% |
| Maximum | 100.0% | 100.0% |
| Range | 68.2% | 28.8% |
| Mean | 69.5% | 85.5% |
| Median | 70.2% | 85.5% |
| Interquartile 25% (IQ1) | 58.7% | 82.6% |
| Interquartile 75% (IQ3) | 81.1% | 87.1% |
| Interquartile Range (IQR) | 22.4% | 4.5% |
| Standard Deviation (Sample) | 15.9% | 5.2% |
| Standard Deviation (Population) | 15.8% | 5.2% |
Similar Demographics by In Labor Force | Age 35-44
Demographics Similar to Navajo by In Labor Force | Age 35-44
In terms of in labor force | age 35-44, the demographic groups most similar to Navajo are Tohono O'odham (74.1%, a difference of 0.38%), Yuman (74.7%, a difference of 1.2%), Pima (74.8%, a difference of 1.3%), Immigrants from Yemen (76.3%, a difference of 3.3%), and Crow (76.5%, a difference of 3.6%).
| Demographics | Rating | Rank | In Labor Force | Age 35-44 |
| Kiowa | 0.0 /100 | #333 | Tragic 79.2% |
| Yakama | 0.0 /100 | #334 | Tragic 79.0% |
| Natives/Alaskans | 0.0 /100 | #335 | Tragic 78.9% |
| Arapaho | 0.0 /100 | #336 | Tragic 78.1% |
| Apache | 0.0 /100 | #337 | Tragic 77.9% |
| Pueblo | 0.0 /100 | #338 | Tragic 77.4% |
| Yup'ik | 0.0 /100 | #339 | Tragic 77.3% |
| Lumbee | 0.0 /100 | #340 | Tragic 77.0% |
| Hopi | 0.0 /100 | #341 | Tragic 77.0% |
| Crow | 0.0 /100 | #342 | Tragic 76.5% |
| Immigrants | Yemen | 0.0 /100 | #343 | Tragic 76.3% |
| Pima | 0.0 /100 | #344 | Tragic 74.8% |
| Yuman | 0.0 /100 | #345 | Tragic 74.7% |
| Tohono O'odham | 0.0 /100 | #346 | Tragic 74.1% |
| Navajo | 0.0 /100 | #347 | Tragic 73.8% |
Demographics Similar to Immigrants from Brazil by In Labor Force | Age 35-44
In terms of in labor force | age 35-44, the demographic groups most similar to Immigrants from Brazil are Immigrants from Haiti (85.0%, a difference of 0.0%), Swedish (85.0%, a difference of 0.010%), Immigrants from Italy (85.0%, a difference of 0.010%), Immigrants from Moldova (85.0%, a difference of 0.020%), and Immigrants from Uganda (85.0%, a difference of 0.020%).
| Demographics | Rating | Rank | In Labor Force | Age 35-44 |
| Slovaks | 99.4 /100 | #58 | Exceptional 85.1% |
| Serbians | 99.4 /100 | #59 | Exceptional 85.1% |
| Albanians | 99.4 /100 | #60 | Exceptional 85.1% |
| Immigrants | Latvia | 99.3 /100 | #61 | Exceptional 85.0% |
| Immigrants | Moldova | 99.3 /100 | #62 | Exceptional 85.0% |
| Immigrants | Uganda | 99.3 /100 | #63 | Exceptional 85.0% |
| Swedes | 99.2 /100 | #64 | Exceptional 85.0% |
| Immigrants | Brazil | 99.2 /100 | #65 | Exceptional 85.0% |
| Immigrants | Haiti | 99.1 /100 | #66 | Exceptional 85.0% |
| Immigrants | Italy | 99.1 /100 | #67 | Exceptional 85.0% |
| Italians | 99.1 /100 | #68 | Exceptional 85.0% |
| Sudanese | 99.0 /100 | #69 | Exceptional 85.0% |
| Brazilians | 99.0 /100 | #70 | Exceptional 85.0% |
| Russians | 99.0 /100 | #71 | Exceptional 85.0% |
| Immigrants | Singapore | 98.9 /100 | #72 | Exceptional 85.0% |