British West Indian vs Creek In Labor Force | Age 25-29
COMPARE
British West Indian
Creek
In Labor Force | Age 25-29
In Labor Force | Age 25-29 Comparison
British West Indians
Creek
83.2%
IN LABOR FORCE | AGE 25-29
0.0/ 100
METRIC RATING
279th/ 347
METRIC RANK
80.7%
IN LABOR FORCE | AGE 25-29
0.0/ 100
METRIC RATING
328th/ 347
METRIC RANK
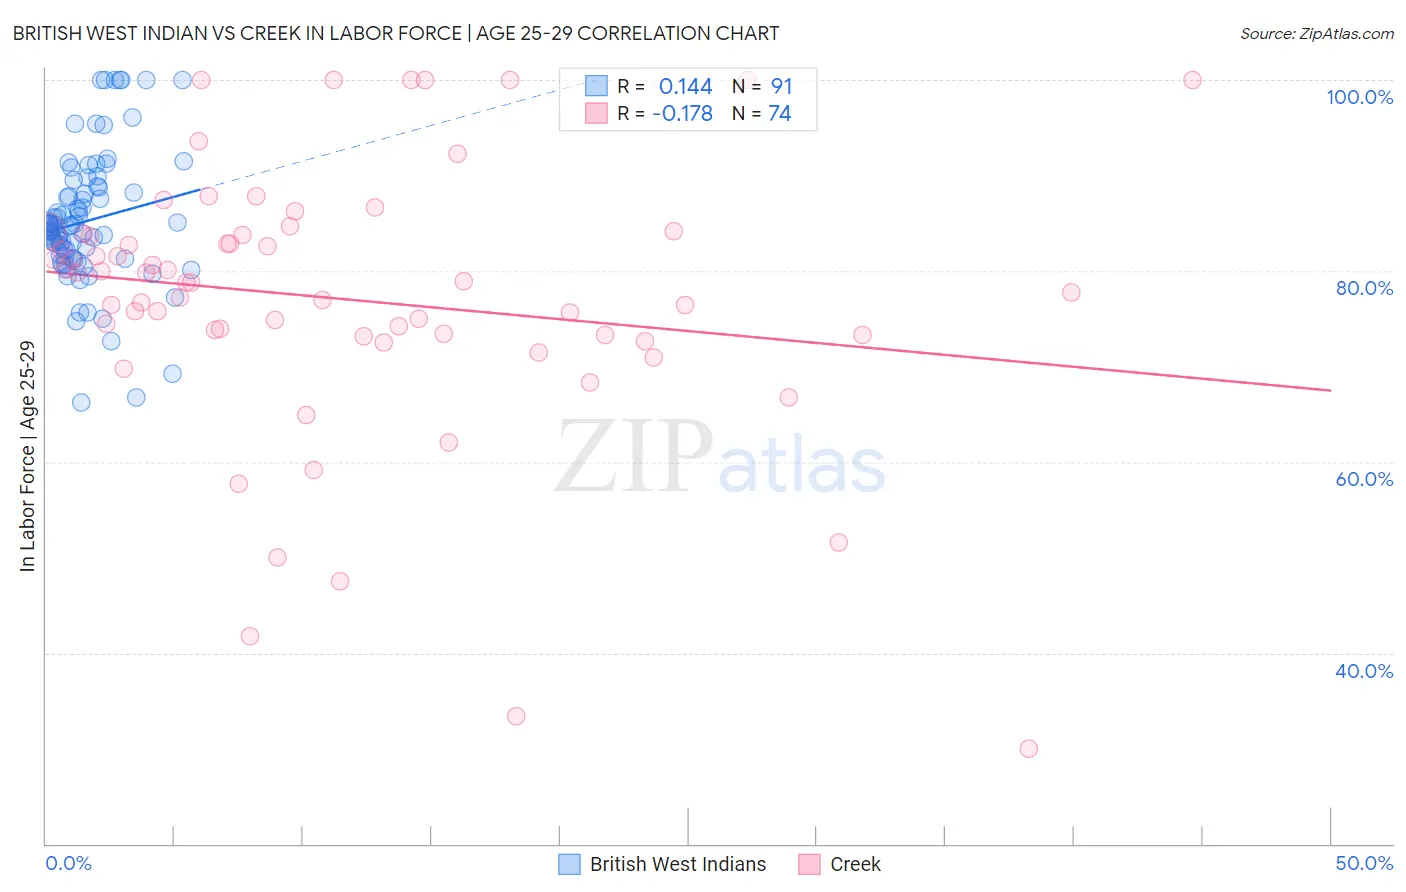
British West Indian vs Creek In Labor Force | Age 25-29 Correlation Chart
The statistical analysis conducted on geographies consisting of 152,666,042 people shows a poor positive correlation between the proportion of British West Indians and labor force participation rate among population between the ages 25 and 29 in the United States with a correlation coefficient (R) of 0.144 and weighted average of 83.2%. Similarly, the statistical analysis conducted on geographies consisting of 178,425,727 people shows a poor negative correlation between the proportion of Creek and labor force participation rate among population between the ages 25 and 29 in the United States with a correlation coefficient (R) of -0.178 and weighted average of 80.7%, a difference of 3.1%.
In Labor Force | Age 25-29 Correlation Summary
| Measurement | British West Indian | Creek |
| Minimum | 66.2% | 30.0% |
| Maximum | 100.0% | 100.0% |
| Range | 33.8% | 70.0% |
| Mean | 85.2% | 77.0% |
| Median | 84.7% | 78.8% |
| Interquartile 25% (IQ1) | 81.3% | 73.3% |
| Interquartile 75% (IQ3) | 88.8% | 83.8% |
| Interquartile Range (IQR) | 7.5% | 10.5% |
| Standard Deviation (Sample) | 7.0% | 14.1% |
| Standard Deviation (Population) | 6.9% | 14.0% |
Similar Demographics by In Labor Force | Age 25-29
Demographics Similar to British West Indians by In Labor Force | Age 25-29
In terms of in labor force | age 25-29, the demographic groups most similar to British West Indians are Immigrants from Cuba (83.2%, a difference of 0.010%), Dominican (83.2%, a difference of 0.020%), African (83.2%, a difference of 0.060%), Immigrants from Dominican Republic (83.1%, a difference of 0.080%), and American (83.1%, a difference of 0.090%).
| Demographics | Rating | Rank | In Labor Force | Age 25-29 |
| Immigrants | Caribbean | 0.0 /100 | #272 | Tragic 83.4% |
| Immigrants | Dominica | 0.0 /100 | #273 | Tragic 83.4% |
| Marshallese | 0.0 /100 | #274 | Tragic 83.3% |
| Samoans | 0.0 /100 | #275 | Tragic 83.3% |
| Immigrants | Honduras | 0.0 /100 | #276 | Tragic 83.3% |
| Africans | 0.0 /100 | #277 | Tragic 83.2% |
| Immigrants | Cuba | 0.0 /100 | #278 | Tragic 83.2% |
| British West Indians | 0.0 /100 | #279 | Tragic 83.2% |
| Dominicans | 0.0 /100 | #280 | Tragic 83.2% |
| Immigrants | Dominican Republic | 0.0 /100 | #281 | Tragic 83.1% |
| Americans | 0.0 /100 | #282 | Tragic 83.1% |
| Immigrants | Azores | 0.0 /100 | #283 | Tragic 83.1% |
| Nicaraguans | 0.0 /100 | #284 | Tragic 83.1% |
| Belizeans | 0.0 /100 | #285 | Tragic 83.1% |
| Mexican American Indians | 0.0 /100 | #286 | Tragic 83.0% |
Demographics Similar to Creek by In Labor Force | Age 25-29
In terms of in labor force | age 25-29, the demographic groups most similar to Creek are Yakama (80.6%, a difference of 0.11%), Ute (80.8%, a difference of 0.15%), Puerto Rican (80.4%, a difference of 0.34%), Choctaw (81.0%, a difference of 0.35%), and Cheyenne (80.3%, a difference of 0.48%).
| Demographics | Rating | Rank | In Labor Force | Age 25-29 |
| Shoshone | 0.0 /100 | #321 | Tragic 81.6% |
| Kiowa | 0.0 /100 | #322 | Tragic 81.6% |
| Alaska Natives | 0.0 /100 | #323 | Tragic 81.6% |
| Houma | 0.0 /100 | #324 | Tragic 81.2% |
| Dutch West Indians | 0.0 /100 | #325 | Tragic 81.1% |
| Choctaw | 0.0 /100 | #326 | Tragic 81.0% |
| Ute | 0.0 /100 | #327 | Tragic 80.8% |
| Creek | 0.0 /100 | #328 | Tragic 80.7% |
| Yakama | 0.0 /100 | #329 | Tragic 80.6% |
| Puerto Ricans | 0.0 /100 | #330 | Tragic 80.4% |
| Cheyenne | 0.0 /100 | #331 | Tragic 80.3% |
| Inupiat | 0.0 /100 | #332 | Tragic 79.8% |
| Sioux | 0.0 /100 | #333 | Tragic 79.7% |
| Yuman | 0.0 /100 | #334 | Tragic 79.3% |
| Natives/Alaskans | 0.0 /100 | #335 | Tragic 79.3% |