Chickasaw vs Argentinean Child Poverty Under the Age of 16
COMPARE
Chickasaw
Argentinean
Child Poverty Under the Age of 16
Child Poverty Under the Age of 16 Comparison
Chickasaw
Argentineans
19.5%
CHILD POVERTY UNDER THE AGE OF 16
0.1/ 100
METRIC RATING
265th/ 347
METRIC RANK
14.6%
CHILD POVERTY UNDER THE AGE OF 16
96.6/ 100
METRIC RATING
93rd/ 347
METRIC RANK
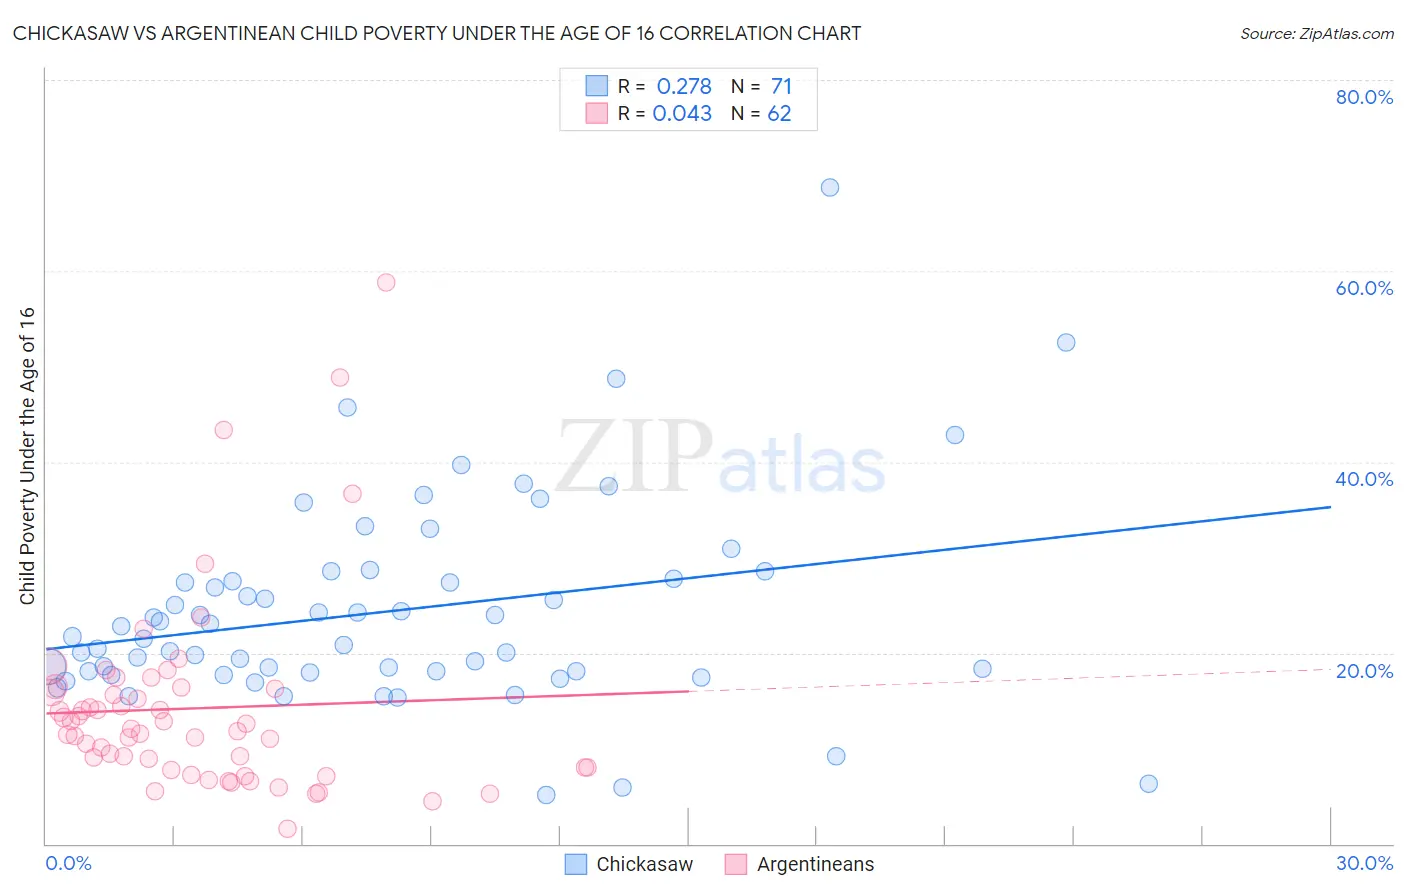
Chickasaw vs Argentinean Child Poverty Under the Age of 16 Correlation Chart
The statistical analysis conducted on geographies consisting of 147,366,373 people shows a weak positive correlation between the proportion of Chickasaw and poverty level among children under the age of 16 in the United States with a correlation coefficient (R) of 0.278 and weighted average of 19.5%. Similarly, the statistical analysis conducted on geographies consisting of 295,166,433 people shows no correlation between the proportion of Argentineans and poverty level among children under the age of 16 in the United States with a correlation coefficient (R) of 0.043 and weighted average of 14.6%, a difference of 33.5%.
Child Poverty Under the Age of 16 Correlation Summary
| Measurement | Chickasaw | Argentinean |
| Minimum | 5.1% | 1.6% |
| Maximum | 68.8% | 58.8% |
| Range | 63.7% | 57.2% |
| Mean | 24.3% | 14.2% |
| Median | 21.7% | 11.9% |
| Interquartile 25% (IQ1) | 18.0% | 8.0% |
| Interquartile 75% (IQ3) | 27.8% | 16.3% |
| Interquartile Range (IQR) | 9.8% | 8.2% |
| Standard Deviation (Sample) | 10.7% | 10.3% |
| Standard Deviation (Population) | 10.6% | 10.2% |
Similar Demographics by Child Poverty Under the Age of 16
Demographics Similar to Chickasaw by Child Poverty Under the Age of 16
In terms of child poverty under the age of 16, the demographic groups most similar to Chickasaw are Liberian (19.5%, a difference of 0.10%), Immigrants from Ecuador (19.4%, a difference of 0.12%), Vietnamese (19.4%, a difference of 0.18%), Cherokee (19.5%, a difference of 0.40%), and Immigrants from Guyana (19.4%, a difference of 0.49%).
| Demographics | Rating | Rank | Child Poverty Under the Age of 16 |
| Spanish Americans | 0.2 /100 | #258 | Tragic 19.2% |
| Mexican American Indians | 0.2 /100 | #259 | Tragic 19.3% |
| Guyanese | 0.2 /100 | #260 | Tragic 19.3% |
| Immigrants | Burma/Myanmar | 0.1 /100 | #261 | Tragic 19.4% |
| Immigrants | Guyana | 0.1 /100 | #262 | Tragic 19.4% |
| Vietnamese | 0.1 /100 | #263 | Tragic 19.4% |
| Immigrants | Ecuador | 0.1 /100 | #264 | Tragic 19.4% |
| Chickasaw | 0.1 /100 | #265 | Tragic 19.5% |
| Liberians | 0.1 /100 | #266 | Tragic 19.5% |
| Cherokee | 0.1 /100 | #267 | Tragic 19.5% |
| Jamaicans | 0.1 /100 | #268 | Tragic 19.7% |
| Immigrants | El Salvador | 0.1 /100 | #269 | Tragic 19.7% |
| Spanish American Indians | 0.1 /100 | #270 | Tragic 19.7% |
| Immigrants | Liberia | 0.1 /100 | #271 | Tragic 19.7% |
| Immigrants | Bangladesh | 0.1 /100 | #272 | Tragic 19.8% |
Demographics Similar to Argentineans by Child Poverty Under the Age of 16
In terms of child poverty under the age of 16, the demographic groups most similar to Argentineans are Immigrants from Italy (14.6%, a difference of 0.090%), Immigrants from North America (14.6%, a difference of 0.12%), Immigrants from South Africa (14.6%, a difference of 0.28%), Austrian (14.5%, a difference of 0.31%), and German (14.5%, a difference of 0.37%).
| Demographics | Rating | Rank | Child Poverty Under the Age of 16 |
| Immigrants | Argentina | 97.1 /100 | #86 | Exceptional 14.5% |
| Taiwanese | 97.1 /100 | #87 | Exceptional 14.5% |
| Northern Europeans | 97.0 /100 | #88 | Exceptional 14.5% |
| Germans | 96.9 /100 | #89 | Exceptional 14.5% |
| Austrians | 96.9 /100 | #90 | Exceptional 14.5% |
| Immigrants | North America | 96.7 /100 | #91 | Exceptional 14.6% |
| Immigrants | Italy | 96.7 /100 | #92 | Exceptional 14.6% |
| Argentineans | 96.6 /100 | #93 | Exceptional 14.6% |
| Immigrants | South Africa | 96.3 /100 | #94 | Exceptional 14.6% |
| Immigrants | Croatia | 96.1 /100 | #95 | Exceptional 14.6% |
| Immigrants | France | 95.8 /100 | #96 | Exceptional 14.7% |
| Paraguayans | 95.7 /100 | #97 | Exceptional 14.7% |
| Immigrants | Belarus | 95.7 /100 | #98 | Exceptional 14.7% |
| British | 95.5 /100 | #99 | Exceptional 14.7% |
| Dutch | 95.1 /100 | #100 | Exceptional 14.8% |