Chickasaw vs Belgian In Labor Force | Age 20-24
COMPARE
Chickasaw
Belgian
In Labor Force | Age 20-24
In Labor Force | Age 20-24 Comparison
Chickasaw
Belgians
74.5%
IN LABOR FORCE | AGE 20-24
10.3/ 100
METRIC RATING
221st/ 347
METRIC RANK
77.8%
IN LABOR FORCE | AGE 20-24
100.0/ 100
METRIC RATING
28th/ 347
METRIC RANK
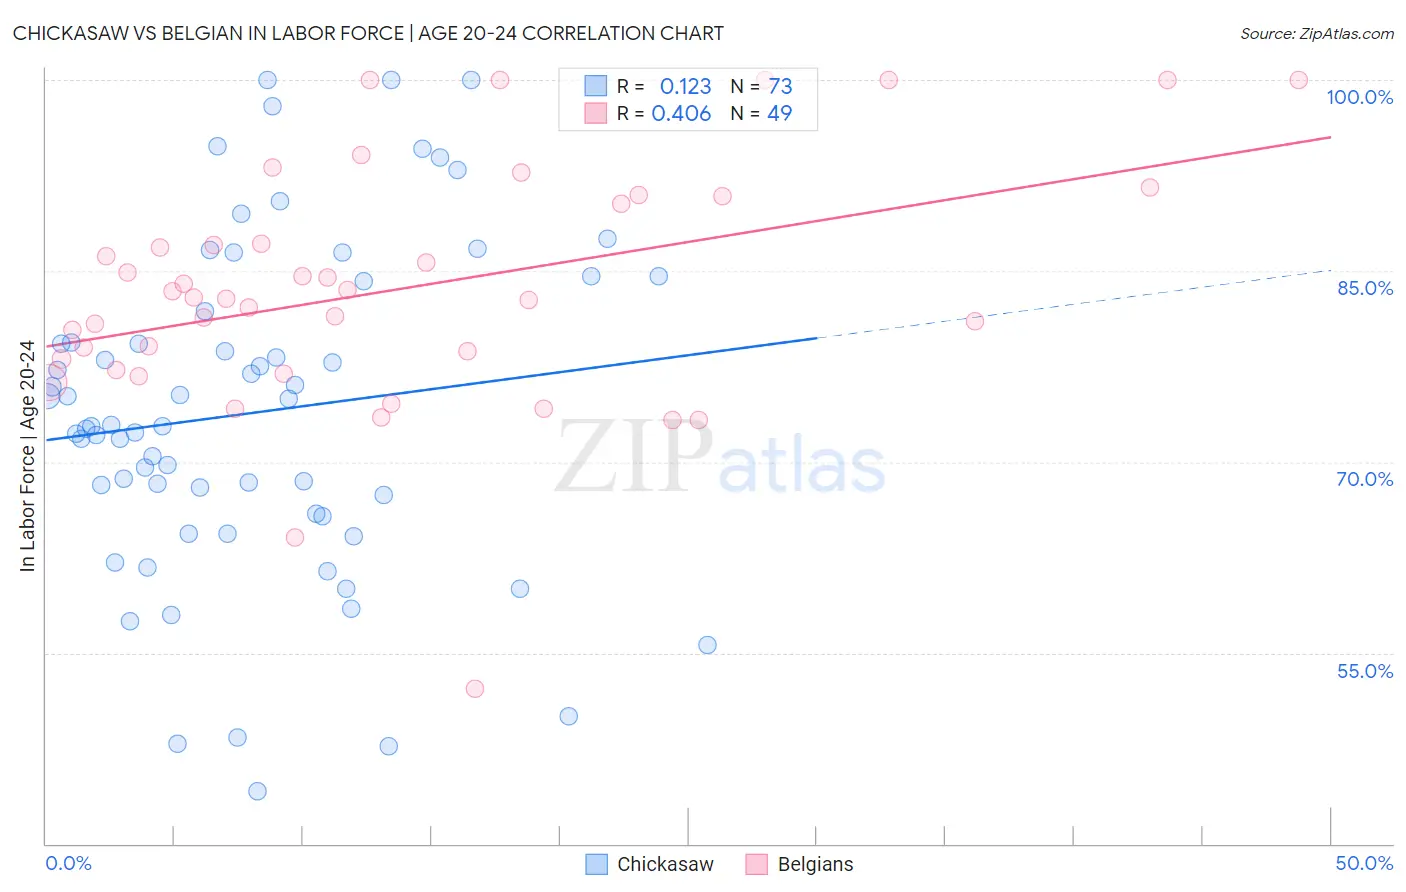
Chickasaw vs Belgian In Labor Force | Age 20-24 Correlation Chart
The statistical analysis conducted on geographies consisting of 147,683,013 people shows a poor positive correlation between the proportion of Chickasaw and labor force participation rate among population between the ages 20 and 24 in the United States with a correlation coefficient (R) of 0.123 and weighted average of 74.5%. Similarly, the statistical analysis conducted on geographies consisting of 355,814,007 people shows a moderate positive correlation between the proportion of Belgians and labor force participation rate among population between the ages 20 and 24 in the United States with a correlation coefficient (R) of 0.406 and weighted average of 77.8%, a difference of 4.5%.
In Labor Force | Age 20-24 Correlation Summary
| Measurement | Chickasaw | Belgian |
| Minimum | 44.1% | 52.2% |
| Maximum | 100.0% | 100.0% |
| Range | 55.9% | 47.8% |
| Mean | 73.9% | 83.6% |
| Median | 72.8% | 82.9% |
| Interquartile 25% (IQ1) | 65.8% | 77.6% |
| Interquartile 75% (IQ3) | 83.0% | 90.6% |
| Interquartile Range (IQR) | 17.2% | 13.0% |
| Standard Deviation (Sample) | 13.1% | 9.6% |
| Standard Deviation (Population) | 13.0% | 9.5% |
Similar Demographics by In Labor Force | Age 20-24
Demographics Similar to Chickasaw by In Labor Force | Age 20-24
In terms of in labor force | age 20-24, the demographic groups most similar to Chickasaw are Immigrants from Norway (74.5%, a difference of 0.0%), Immigrants from Peru (74.5%, a difference of 0.010%), Nepalese (74.5%, a difference of 0.010%), Immigrants from India (74.4%, a difference of 0.020%), and Chilean (74.5%, a difference of 0.080%).
| Demographics | Rating | Rank | In Labor Force | Age 20-24 |
| Immigrants | Southern Europe | 13.2 /100 | #214 | Poor 74.5% |
| Immigrants | Ghana | 12.7 /100 | #215 | Poor 74.5% |
| Immigrants | Kuwait | 12.7 /100 | #216 | Poor 74.5% |
| Chileans | 12.5 /100 | #217 | Poor 74.5% |
| Immigrants | Peru | 10.6 /100 | #218 | Poor 74.5% |
| Nepalese | 10.5 /100 | #219 | Poor 74.5% |
| Immigrants | Norway | 10.3 /100 | #220 | Poor 74.5% |
| Chickasaw | 10.3 /100 | #221 | Poor 74.5% |
| Immigrants | India | 9.9 /100 | #222 | Tragic 74.4% |
| Hispanics or Latinos | 7.9 /100 | #223 | Tragic 74.4% |
| Seminole | 6.9 /100 | #224 | Tragic 74.3% |
| Ghanaians | 6.2 /100 | #225 | Tragic 74.3% |
| Immigrants | Fiji | 5.9 /100 | #226 | Tragic 74.3% |
| Immigrants | Ireland | 5.8 /100 | #227 | Tragic 74.3% |
| Immigrants | Ukraine | 5.1 /100 | #228 | Tragic 74.2% |
Demographics Similar to Belgians by In Labor Force | Age 20-24
In terms of in labor force | age 20-24, the demographic groups most similar to Belgians are Immigrants from Micronesia (77.8%, a difference of 0.040%), Slovak (77.7%, a difference of 0.090%), Swiss (77.7%, a difference of 0.10%), Tongan (77.9%, a difference of 0.16%), and Tlingit-Haida (77.9%, a difference of 0.18%).
| Demographics | Rating | Rank | In Labor Force | Age 20-24 |
| Puget Sound Salish | 100.0 /100 | #21 | Exceptional 78.0% |
| Pennsylvania Germans | 100.0 /100 | #22 | Exceptional 78.0% |
| Yugoslavians | 100.0 /100 | #23 | Exceptional 78.0% |
| Liberians | 100.0 /100 | #24 | Exceptional 78.0% |
| Tlingit-Haida | 100.0 /100 | #25 | Exceptional 77.9% |
| Tongans | 100.0 /100 | #26 | Exceptional 77.9% |
| Immigrants | Micronesia | 100.0 /100 | #27 | Exceptional 77.8% |
| Belgians | 100.0 /100 | #28 | Exceptional 77.8% |
| Slovaks | 100.0 /100 | #29 | Exceptional 77.7% |
| Swiss | 100.0 /100 | #30 | Exceptional 77.7% |
| Poles | 100.0 /100 | #31 | Exceptional 77.6% |
| English | 100.0 /100 | #32 | Exceptional 77.6% |
| Immigrants | Ethiopia | 100.0 /100 | #33 | Exceptional 77.5% |
| German Russians | 100.0 /100 | #34 | Exceptional 77.5% |
| Immigrants | Eastern Africa | 100.0 /100 | #35 | Exceptional 77.5% |