Cheyenne vs Polish In Labor Force | Age 35-44
COMPARE
Cheyenne
Polish
In Labor Force | Age 35-44
In Labor Force | Age 35-44 Comparison
Cheyenne
Poles
79.5%
IN LABOR FORCE | AGE 35-44
0.0/ 100
METRIC RATING
330th/ 347
METRIC RANK
85.2%
IN LABOR FORCE | AGE 35-44
99.8/ 100
METRIC RATING
43rd/ 347
METRIC RANK
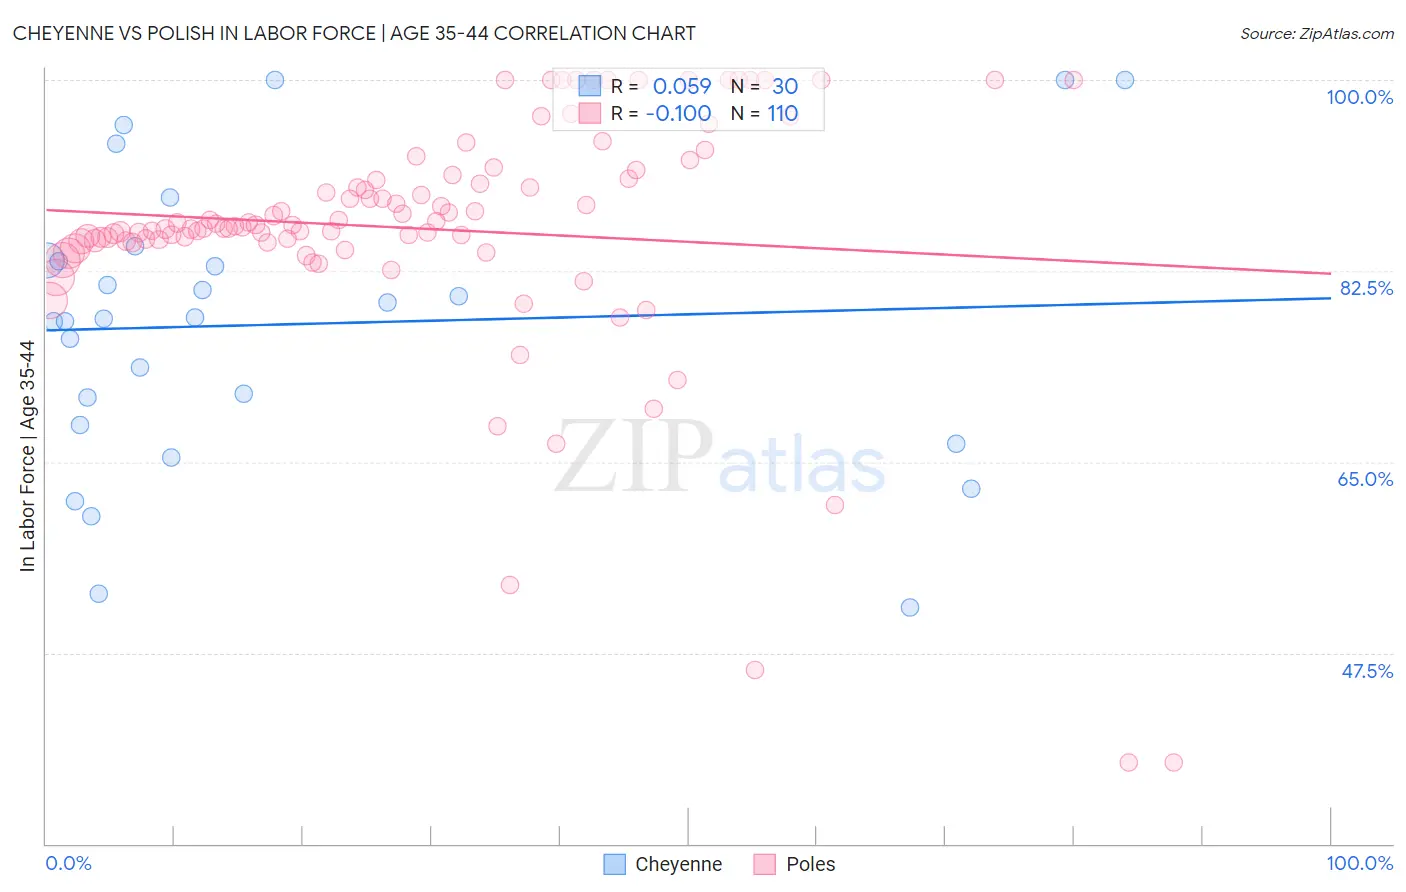
Cheyenne vs Polish In Labor Force | Age 35-44 Correlation Chart
The statistical analysis conducted on geographies consisting of 80,703,463 people shows a slight positive correlation between the proportion of Cheyenne and labor force participation rate among population between the ages 35 and 44 in the United States with a correlation coefficient (R) of 0.059 and weighted average of 79.5%. Similarly, the statistical analysis conducted on geographies consisting of 559,917,844 people shows a poor negative correlation between the proportion of Poles and labor force participation rate among population between the ages 35 and 44 in the United States with a correlation coefficient (R) of -0.100 and weighted average of 85.2%, a difference of 7.2%.
In Labor Force | Age 35-44 Correlation Summary
| Measurement | Cheyenne | Polish |
| Minimum | 51.7% | 37.5% |
| Maximum | 100.0% | 100.0% |
| Range | 48.3% | 62.5% |
| Mean | 77.6% | 86.4% |
| Median | 78.2% | 86.6% |
| Interquartile 25% (IQ1) | 68.3% | 85.2% |
| Interquartile 75% (IQ3) | 83.4% | 90.9% |
| Interquartile Range (IQR) | 15.1% | 5.7% |
| Standard Deviation (Sample) | 13.1% | 11.1% |
| Standard Deviation (Population) | 12.9% | 11.1% |
Similar Demographics by In Labor Force | Age 35-44
Demographics Similar to Cheyenne by In Labor Force | Age 35-44
In terms of in labor force | age 35-44, the demographic groups most similar to Cheyenne are Houma (79.5%, a difference of 0.020%), Ute (79.4%, a difference of 0.080%), Menominee (79.7%, a difference of 0.20%), Kiowa (79.2%, a difference of 0.41%), and Creek (80.0%, a difference of 0.64%).
| Demographics | Rating | Rank | In Labor Force | Age 35-44 |
| Yaqui | 0.0 /100 | #323 | Tragic 80.5% |
| Choctaw | 0.0 /100 | #324 | Tragic 80.5% |
| Dutch West Indians | 0.0 /100 | #325 | Tragic 80.4% |
| Seminole | 0.0 /100 | #326 | Tragic 80.4% |
| Sioux | 0.0 /100 | #327 | Tragic 80.2% |
| Creek | 0.0 /100 | #328 | Tragic 80.0% |
| Menominee | 0.0 /100 | #329 | Tragic 79.7% |
| Cheyenne | 0.0 /100 | #330 | Tragic 79.5% |
| Houma | 0.0 /100 | #331 | Tragic 79.5% |
| Ute | 0.0 /100 | #332 | Tragic 79.4% |
| Kiowa | 0.0 /100 | #333 | Tragic 79.2% |
| Yakama | 0.0 /100 | #334 | Tragic 79.0% |
| Natives/Alaskans | 0.0 /100 | #335 | Tragic 78.9% |
| Arapaho | 0.0 /100 | #336 | Tragic 78.1% |
| Apache | 0.0 /100 | #337 | Tragic 77.9% |
Demographics Similar to Poles by In Labor Force | Age 35-44
In terms of in labor force | age 35-44, the demographic groups most similar to Poles are Lithuanian (85.2%, a difference of 0.0%), Immigrants from Bulgaria (85.2%, a difference of 0.010%), Immigrants from Zimbabwe (85.2%, a difference of 0.010%), Macedonian (85.2%, a difference of 0.010%), and Immigrants from Poland (85.2%, a difference of 0.020%).
| Demographics | Rating | Rank | In Labor Force | Age 35-44 |
| Immigrants | Morocco | 99.8 /100 | #36 | Exceptional 85.2% |
| Kenyans | 99.8 /100 | #37 | Exceptional 85.2% |
| Immigrants | Poland | 99.8 /100 | #38 | Exceptional 85.2% |
| Eastern Europeans | 99.8 /100 | #39 | Exceptional 85.2% |
| Immigrants | Bulgaria | 99.8 /100 | #40 | Exceptional 85.2% |
| Immigrants | Zimbabwe | 99.8 /100 | #41 | Exceptional 85.2% |
| Macedonians | 99.8 /100 | #42 | Exceptional 85.2% |
| Poles | 99.8 /100 | #43 | Exceptional 85.2% |
| Lithuanians | 99.8 /100 | #44 | Exceptional 85.2% |
| Cypriots | 99.8 /100 | #45 | Exceptional 85.2% |
| Immigrants | Hong Kong | 99.8 /100 | #46 | Exceptional 85.2% |
| German Russians | 99.8 /100 | #47 | Exceptional 85.2% |
| Immigrants | Eritrea | 99.7 /100 | #48 | Exceptional 85.2% |
| Croatians | 99.7 /100 | #49 | Exceptional 85.2% |
| Thais | 99.7 /100 | #50 | Exceptional 85.2% |