Cheyenne vs Polish Householder Income Ages 45 - 64 years
COMPARE
Cheyenne
Polish
Householder Income Ages 45 - 64 years
Householder Income Ages 45 - 64 years Comparison
Cheyenne
Poles
$76,362
HOUSEHOLDER INCOME AGES 45 - 64 YEARS
0.0/ 100
METRIC RATING
335th/ 347
METRIC RANK
$105,952
HOUSEHOLDER INCOME AGES 45 - 64 YEARS
94.4/ 100
METRIC RATING
121st/ 347
METRIC RANK
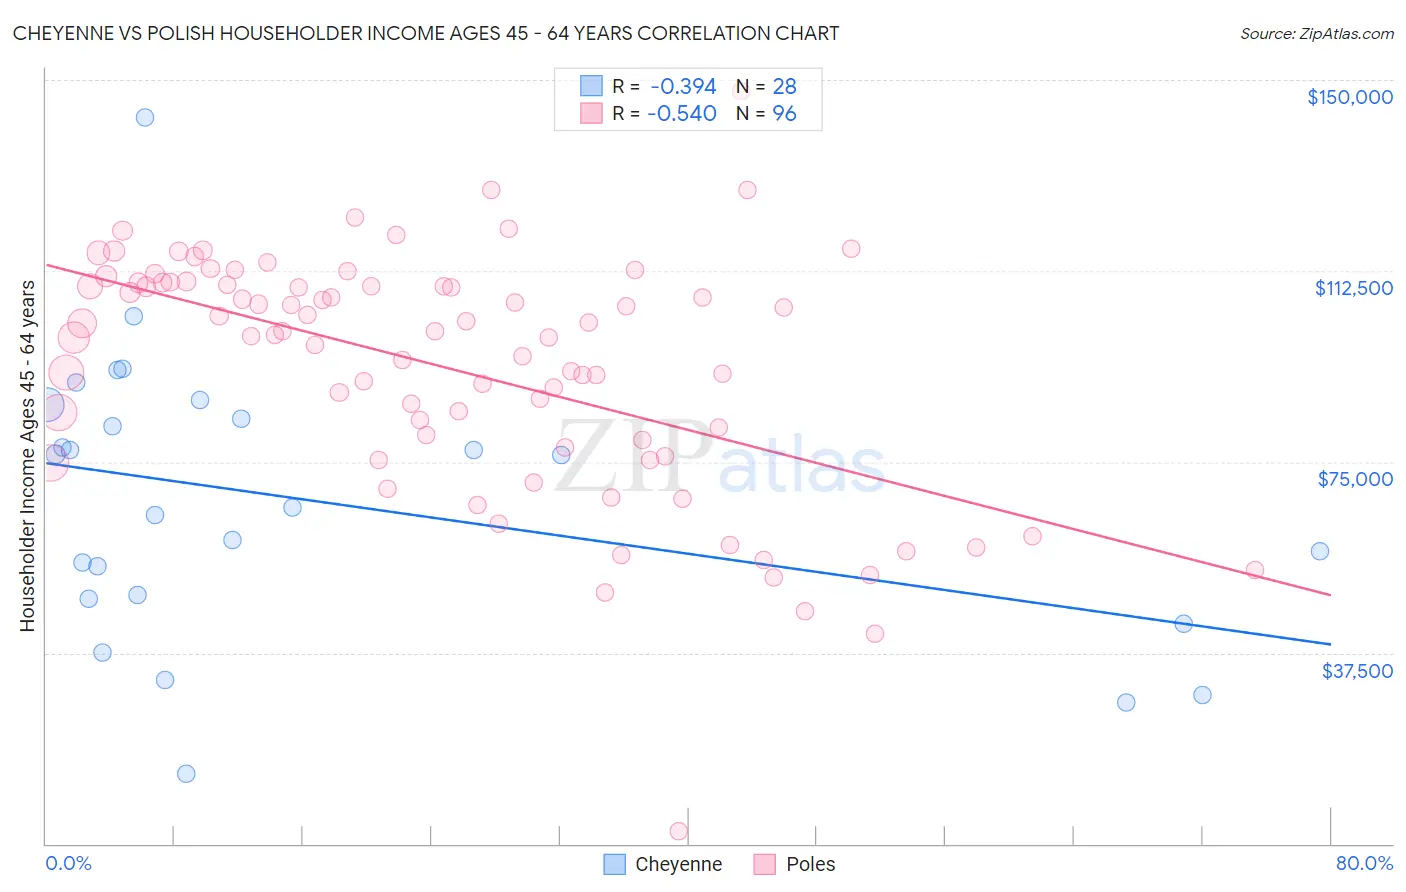
Cheyenne vs Polish Householder Income Ages 45 - 64 years Correlation Chart
The statistical analysis conducted on geographies consisting of 80,666,716 people shows a mild negative correlation between the proportion of Cheyenne and household income with householder between the ages 45 and 64 in the United States with a correlation coefficient (R) of -0.394 and weighted average of $76,362. Similarly, the statistical analysis conducted on geographies consisting of 557,394,661 people shows a substantial negative correlation between the proportion of Poles and household income with householder between the ages 45 and 64 in the United States with a correlation coefficient (R) of -0.540 and weighted average of $105,952, a difference of 38.8%.
Householder Income Ages 45 - 64 years Correlation Summary
| Measurement | Cheyenne | Polish |
| Minimum | $13,750 | $2,499 |
| Maximum | $142,727 | $147,814 |
| Range | $128,977 | $145,315 |
| Mean | $67,332 | $93,436 |
| Median | $71,250 | $100,304 |
| Interquartile 25% (IQ1) | $48,460 | $78,490 |
| Interquartile 75% (IQ3) | $84,816 | $109,945 |
| Interquartile Range (IQR) | $36,356 | $31,456 |
| Standard Deviation (Sample) | $27,465 | $23,791 |
| Standard Deviation (Population) | $26,970 | $23,667 |
Similar Demographics by Householder Income Ages 45 - 64 years
Demographics Similar to Cheyenne by Householder Income Ages 45 - 64 years
In terms of householder income ages 45 - 64 years, the demographic groups most similar to Cheyenne are Arapaho ($75,945, a difference of 0.55%), Menominee ($76,903, a difference of 0.71%), Pueblo ($75,601, a difference of 1.0%), Hopi ($75,562, a difference of 1.1%), and Immigrants from Congo ($77,850, a difference of 1.9%).
| Demographics | Rating | Rank | Householder Income Ages 45 - 64 years |
| Natives/Alaskans | 0.0 /100 | #328 | Tragic $79,816 |
| Dutch West Indians | 0.0 /100 | #329 | Tragic $79,171 |
| Creek | 0.0 /100 | #330 | Tragic $78,960 |
| Immigrants | Dominican Republic | 0.0 /100 | #331 | Tragic $78,836 |
| Blacks/African Americans | 0.0 /100 | #332 | Tragic $78,556 |
| Immigrants | Congo | 0.0 /100 | #333 | Tragic $77,850 |
| Menominee | 0.0 /100 | #334 | Tragic $76,903 |
| Cheyenne | 0.0 /100 | #335 | Tragic $76,362 |
| Arapaho | 0.0 /100 | #336 | Tragic $75,945 |
| Pueblo | 0.0 /100 | #337 | Tragic $75,601 |
| Hopi | 0.0 /100 | #338 | Tragic $75,562 |
| Kiowa | 0.0 /100 | #339 | Tragic $74,815 |
| Immigrants | Yemen | 0.0 /100 | #340 | Tragic $74,575 |
| Crow | 0.0 /100 | #341 | Tragic $74,257 |
| Tohono O'odham | 0.0 /100 | #342 | Tragic $73,774 |
Demographics Similar to Poles by Householder Income Ages 45 - 64 years
In terms of householder income ages 45 - 64 years, the demographic groups most similar to Poles are Immigrants from North Macedonia ($105,892, a difference of 0.060%), Immigrants from South Eastern Asia ($106,109, a difference of 0.15%), Immigrants from Jordan ($106,164, a difference of 0.20%), Immigrants from Western Asia ($106,217, a difference of 0.25%), and Albanian ($106,243, a difference of 0.27%).
| Demographics | Rating | Rank | Householder Income Ages 45 - 64 years |
| Immigrants | Poland | 95.3 /100 | #114 | Exceptional $106,319 |
| Immigrants | Kuwait | 95.2 /100 | #115 | Exceptional $106,285 |
| British | 95.2 /100 | #116 | Exceptional $106,264 |
| Albanians | 95.1 /100 | #117 | Exceptional $106,243 |
| Immigrants | Western Asia | 95.0 /100 | #118 | Exceptional $106,217 |
| Immigrants | Jordan | 94.9 /100 | #119 | Exceptional $106,164 |
| Immigrants | South Eastern Asia | 94.8 /100 | #120 | Exceptional $106,109 |
| Poles | 94.4 /100 | #121 | Exceptional $105,952 |
| Immigrants | North Macedonia | 94.2 /100 | #122 | Exceptional $105,892 |
| Danes | 93.4 /100 | #123 | Exceptional $105,619 |
| Immigrants | Northern Africa | 92.8 /100 | #124 | Exceptional $105,430 |
| Pakistanis | 92.4 /100 | #125 | Exceptional $105,317 |
| Portuguese | 92.4 /100 | #126 | Exceptional $105,309 |
| Immigrants | Saudi Arabia | 92.2 /100 | #127 | Exceptional $105,249 |
| Native Hawaiians | 91.8 /100 | #128 | Exceptional $105,149 |