Cheyenne vs Guyanese In Labor Force | Age 35-44
COMPARE
Cheyenne
Guyanese
In Labor Force | Age 35-44
In Labor Force | Age 35-44 Comparison
Cheyenne
Guyanese
79.5%
IN LABOR FORCE | AGE 35-44
0.0/ 100
METRIC RATING
330th/ 347
METRIC RANK
83.8%
IN LABOR FORCE | AGE 35-44
1.1/ 100
METRIC RATING
244th/ 347
METRIC RANK
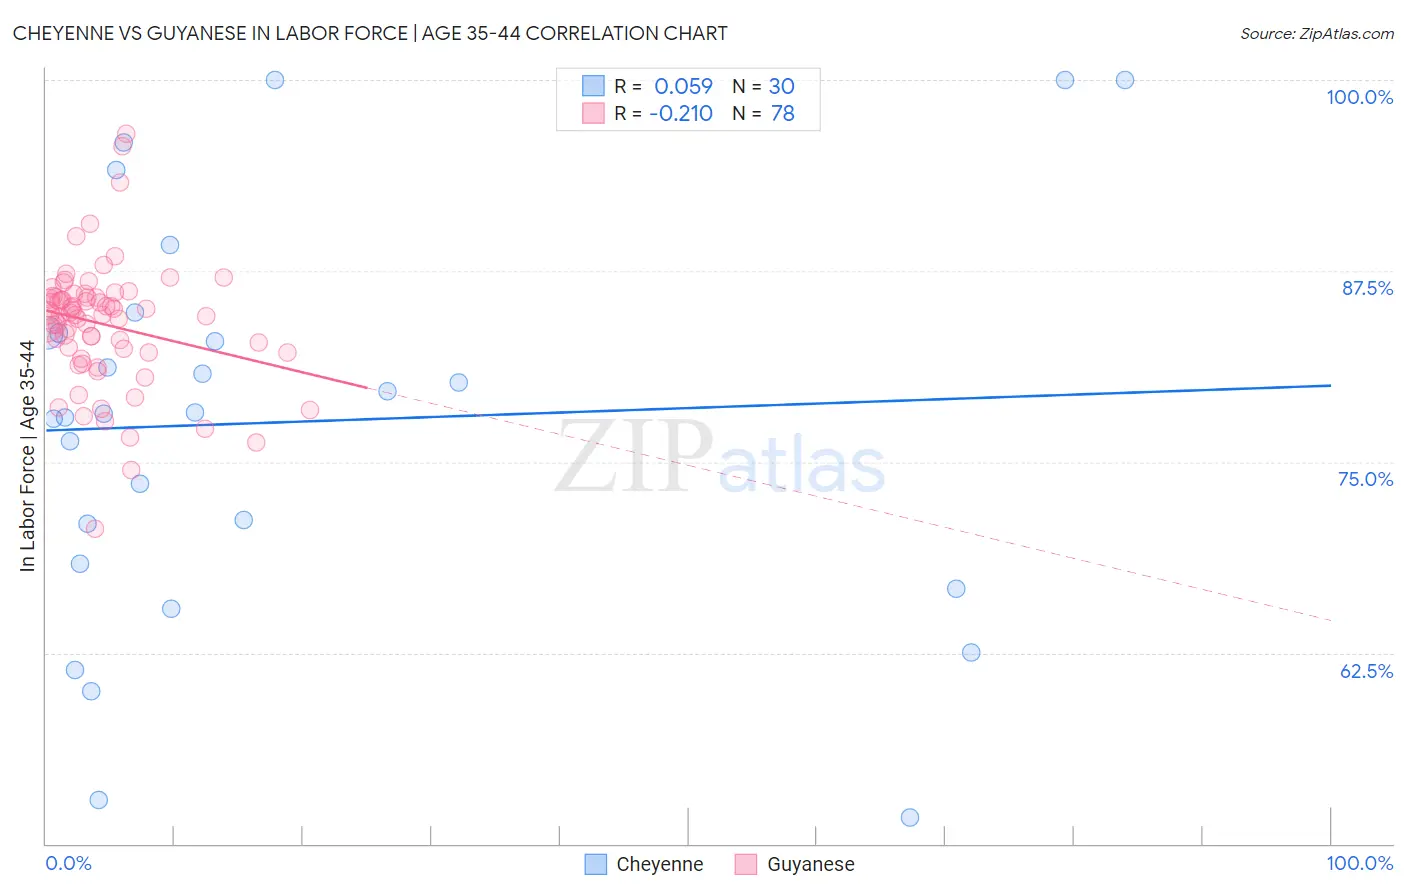
Cheyenne vs Guyanese In Labor Force | Age 35-44 Correlation Chart
The statistical analysis conducted on geographies consisting of 80,703,463 people shows a slight positive correlation between the proportion of Cheyenne and labor force participation rate among population between the ages 35 and 44 in the United States with a correlation coefficient (R) of 0.059 and weighted average of 79.5%. Similarly, the statistical analysis conducted on geographies consisting of 176,803,222 people shows a weak negative correlation between the proportion of Guyanese and labor force participation rate among population between the ages 35 and 44 in the United States with a correlation coefficient (R) of -0.210 and weighted average of 83.8%, a difference of 5.3%.
In Labor Force | Age 35-44 Correlation Summary
| Measurement | Cheyenne | Guyanese |
| Minimum | 51.7% | 70.6% |
| Maximum | 100.0% | 96.5% |
| Range | 48.3% | 25.9% |
| Mean | 77.6% | 84.0% |
| Median | 78.2% | 84.6% |
| Interquartile 25% (IQ1) | 68.3% | 82.2% |
| Interquartile 75% (IQ3) | 83.4% | 85.8% |
| Interquartile Range (IQR) | 15.1% | 3.6% |
| Standard Deviation (Sample) | 13.1% | 4.1% |
| Standard Deviation (Population) | 12.9% | 4.1% |
Similar Demographics by In Labor Force | Age 35-44
Demographics Similar to Cheyenne by In Labor Force | Age 35-44
In terms of in labor force | age 35-44, the demographic groups most similar to Cheyenne are Houma (79.5%, a difference of 0.020%), Ute (79.4%, a difference of 0.080%), Menominee (79.7%, a difference of 0.20%), Kiowa (79.2%, a difference of 0.41%), and Creek (80.0%, a difference of 0.64%).
| Demographics | Rating | Rank | In Labor Force | Age 35-44 |
| Yaqui | 0.0 /100 | #323 | Tragic 80.5% |
| Choctaw | 0.0 /100 | #324 | Tragic 80.5% |
| Dutch West Indians | 0.0 /100 | #325 | Tragic 80.4% |
| Seminole | 0.0 /100 | #326 | Tragic 80.4% |
| Sioux | 0.0 /100 | #327 | Tragic 80.2% |
| Creek | 0.0 /100 | #328 | Tragic 80.0% |
| Menominee | 0.0 /100 | #329 | Tragic 79.7% |
| Cheyenne | 0.0 /100 | #330 | Tragic 79.5% |
| Houma | 0.0 /100 | #331 | Tragic 79.5% |
| Ute | 0.0 /100 | #332 | Tragic 79.4% |
| Kiowa | 0.0 /100 | #333 | Tragic 79.2% |
| Yakama | 0.0 /100 | #334 | Tragic 79.0% |
| Natives/Alaskans | 0.0 /100 | #335 | Tragic 78.9% |
| Arapaho | 0.0 /100 | #336 | Tragic 78.1% |
| Apache | 0.0 /100 | #337 | Tragic 77.9% |
Demographics Similar to Guyanese by In Labor Force | Age 35-44
In terms of in labor force | age 35-44, the demographic groups most similar to Guyanese are Immigrants from Western Asia (83.8%, a difference of 0.0%), Malaysian (83.8%, a difference of 0.0%), Immigrants from Cambodia (83.8%, a difference of 0.010%), Immigrants (83.7%, a difference of 0.010%), and Arab (83.8%, a difference of 0.030%).
| Demographics | Rating | Rank | In Labor Force | Age 35-44 |
| English | 1.8 /100 | #237 | Tragic 83.8% |
| Immigrants | Laos | 1.7 /100 | #238 | Tragic 83.8% |
| Celtics | 1.4 /100 | #239 | Tragic 83.8% |
| Arabs | 1.3 /100 | #240 | Tragic 83.8% |
| Iraqis | 1.3 /100 | #241 | Tragic 83.8% |
| Immigrants | Cambodia | 1.1 /100 | #242 | Tragic 83.8% |
| Immigrants | Western Asia | 1.1 /100 | #243 | Tragic 83.8% |
| Guyanese | 1.1 /100 | #244 | Tragic 83.8% |
| Malaysians | 1.1 /100 | #245 | Tragic 83.8% |
| Immigrants | Immigrants | 1.0 /100 | #246 | Tragic 83.7% |
| Immigrants | Armenia | 0.9 /100 | #247 | Tragic 83.7% |
| Indonesians | 0.8 /100 | #248 | Tragic 83.7% |
| Immigrants | St. Vincent and the Grenadines | 0.7 /100 | #249 | Tragic 83.7% |
| Whites/Caucasians | 0.5 /100 | #250 | Tragic 83.6% |
| Salvadorans | 0.4 /100 | #251 | Tragic 83.6% |