Cheyenne vs Immigrants from Argentina In Labor Force | Age 35-44
COMPARE
Cheyenne
Immigrants from Argentina
In Labor Force | Age 35-44
In Labor Force | Age 35-44 Comparison
Cheyenne
Immigrants from Argentina
79.5%
IN LABOR FORCE | AGE 35-44
0.0/ 100
METRIC RATING
330th/ 347
METRIC RANK
84.8%
IN LABOR FORCE | AGE 35-44
94.5/ 100
METRIC RATING
108th/ 347
METRIC RANK
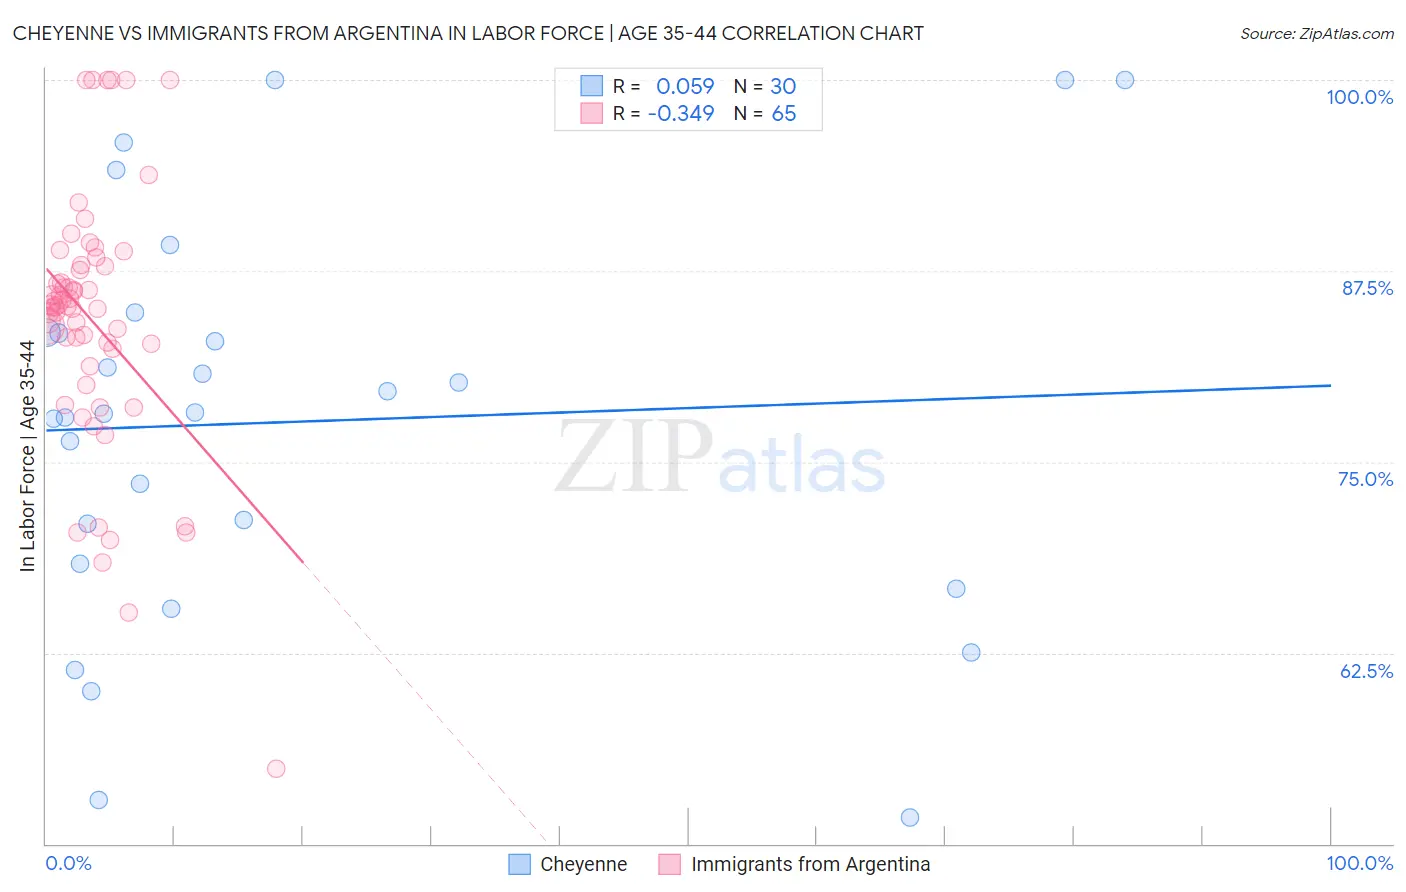
Cheyenne vs Immigrants from Argentina In Labor Force | Age 35-44 Correlation Chart
The statistical analysis conducted on geographies consisting of 80,703,463 people shows a slight positive correlation between the proportion of Cheyenne and labor force participation rate among population between the ages 35 and 44 in the United States with a correlation coefficient (R) of 0.059 and weighted average of 79.5%. Similarly, the statistical analysis conducted on geographies consisting of 264,372,085 people shows a mild negative correlation between the proportion of Immigrants from Argentina and labor force participation rate among population between the ages 35 and 44 in the United States with a correlation coefficient (R) of -0.349 and weighted average of 84.8%, a difference of 6.6%.
In Labor Force | Age 35-44 Correlation Summary
| Measurement | Cheyenne | Immigrants from Argentina |
| Minimum | 51.7% | 54.9% |
| Maximum | 100.0% | 100.0% |
| Range | 48.3% | 45.1% |
| Mean | 77.6% | 84.3% |
| Median | 78.2% | 85.2% |
| Interquartile 25% (IQ1) | 68.3% | 81.8% |
| Interquartile 75% (IQ3) | 83.4% | 87.8% |
| Interquartile Range (IQR) | 15.1% | 6.0% |
| Standard Deviation (Sample) | 13.1% | 8.5% |
| Standard Deviation (Population) | 12.9% | 8.4% |
Similar Demographics by In Labor Force | Age 35-44
Demographics Similar to Cheyenne by In Labor Force | Age 35-44
In terms of in labor force | age 35-44, the demographic groups most similar to Cheyenne are Houma (79.5%, a difference of 0.020%), Ute (79.4%, a difference of 0.080%), Menominee (79.7%, a difference of 0.20%), Kiowa (79.2%, a difference of 0.41%), and Creek (80.0%, a difference of 0.64%).
| Demographics | Rating | Rank | In Labor Force | Age 35-44 |
| Yaqui | 0.0 /100 | #323 | Tragic 80.5% |
| Choctaw | 0.0 /100 | #324 | Tragic 80.5% |
| Dutch West Indians | 0.0 /100 | #325 | Tragic 80.4% |
| Seminole | 0.0 /100 | #326 | Tragic 80.4% |
| Sioux | 0.0 /100 | #327 | Tragic 80.2% |
| Creek | 0.0 /100 | #328 | Tragic 80.0% |
| Menominee | 0.0 /100 | #329 | Tragic 79.7% |
| Cheyenne | 0.0 /100 | #330 | Tragic 79.5% |
| Houma | 0.0 /100 | #331 | Tragic 79.5% |
| Ute | 0.0 /100 | #332 | Tragic 79.4% |
| Kiowa | 0.0 /100 | #333 | Tragic 79.2% |
| Yakama | 0.0 /100 | #334 | Tragic 79.0% |
| Natives/Alaskans | 0.0 /100 | #335 | Tragic 78.9% |
| Arapaho | 0.0 /100 | #336 | Tragic 78.1% |
| Apache | 0.0 /100 | #337 | Tragic 77.9% |
Demographics Similar to Immigrants from Argentina by In Labor Force | Age 35-44
In terms of in labor force | age 35-44, the demographic groups most similar to Immigrants from Argentina are Immigrants from Russia (84.8%, a difference of 0.0%), Immigrants from Bahamas (84.8%, a difference of 0.010%), Immigrants from Romania (84.8%, a difference of 0.010%), Immigrants from Belarus (84.8%, a difference of 0.020%), and Immigrants from Sweden (84.8%, a difference of 0.020%).
| Demographics | Rating | Rank | In Labor Force | Age 35-44 |
| Immigrants | Australia | 95.5 /100 | #101 | Exceptional 84.8% |
| Immigrants | Southern Europe | 95.3 /100 | #102 | Exceptional 84.8% |
| Immigrants | Belarus | 95.3 /100 | #103 | Exceptional 84.8% |
| Immigrants | Sweden | 95.2 /100 | #104 | Exceptional 84.8% |
| South Americans | 95.0 /100 | #105 | Exceptional 84.8% |
| Immigrants | Bahamas | 94.8 /100 | #106 | Exceptional 84.8% |
| Immigrants | Romania | 94.7 /100 | #107 | Exceptional 84.8% |
| Immigrants | Argentina | 94.5 /100 | #108 | Exceptional 84.8% |
| Immigrants | Russia | 94.5 /100 | #109 | Exceptional 84.8% |
| Filipinos | 93.8 /100 | #110 | Exceptional 84.7% |
| Ukrainians | 93.5 /100 | #111 | Exceptional 84.7% |
| Immigrants | Western Africa | 93.4 /100 | #112 | Exceptional 84.7% |
| Uruguayans | 93.3 /100 | #113 | Exceptional 84.7% |
| Chileans | 93.2 /100 | #114 | Exceptional 84.7% |
| Bahamians | 93.2 /100 | #115 | Exceptional 84.7% |