Cheyenne vs Immigrants from Honduras Householder Income Ages 25 - 44 years
COMPARE
Cheyenne
Immigrants from Honduras
Householder Income Ages 25 - 44 years
Householder Income Ages 25 - 44 years Comparison
Cheyenne
Immigrants from Honduras
$79,152
HOUSEHOLDER INCOME AGES 25 - 44 YEARS
0.0/ 100
METRIC RATING
314th/ 347
METRIC RANK
$77,328
HOUSEHOLDER INCOME AGES 25 - 44 YEARS
0.0/ 100
METRIC RATING
323rd/ 347
METRIC RANK
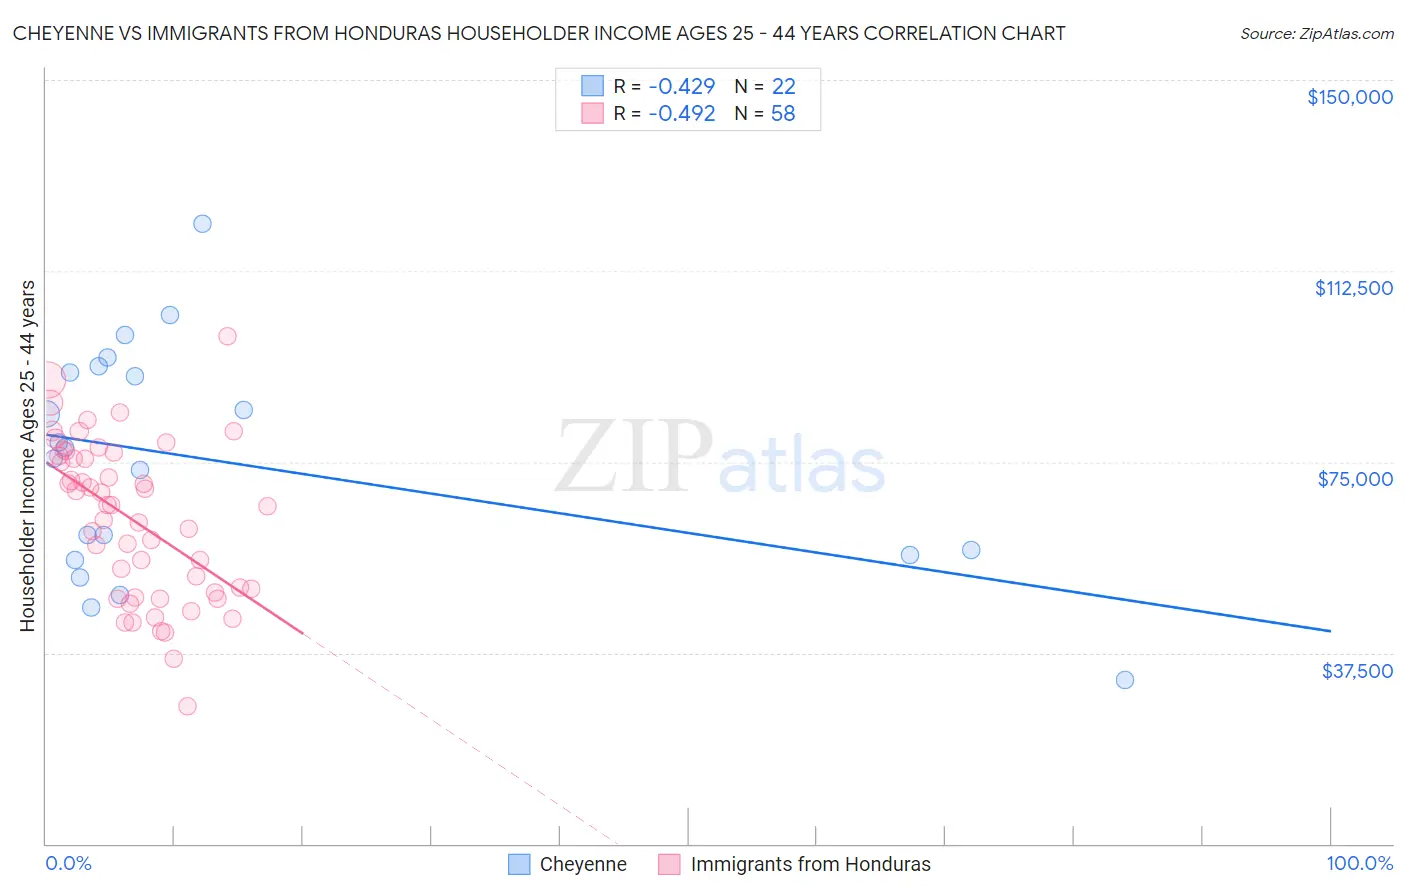
Cheyenne vs Immigrants from Honduras Householder Income Ages 25 - 44 years Correlation Chart
The statistical analysis conducted on geographies consisting of 80,627,434 people shows a moderate negative correlation between the proportion of Cheyenne and household income with householder between the ages 25 and 44 in the United States with a correlation coefficient (R) of -0.429 and weighted average of $79,152. Similarly, the statistical analysis conducted on geographies consisting of 321,952,844 people shows a moderate negative correlation between the proportion of Immigrants from Honduras and household income with householder between the ages 25 and 44 in the United States with a correlation coefficient (R) of -0.492 and weighted average of $77,328, a difference of 2.4%.
Householder Income Ages 25 - 44 years Correlation Summary
| Measurement | Cheyenne | Immigrants from Honduras |
| Minimum | $32,083 | $26,956 |
| Maximum | $121,699 | $99,657 |
| Range | $89,616 | $72,701 |
| Mean | $74,807 | $63,676 |
| Median | $76,769 | $66,366 |
| Interquartile 25% (IQ1) | $56,719 | $49,234 |
| Interquartile 75% (IQ3) | $92,585 | $76,183 |
| Interquartile Range (IQR) | $35,866 | $26,949 |
| Standard Deviation (Sample) | $22,346 | $15,519 |
| Standard Deviation (Population) | $21,832 | $15,385 |
Demographics Similar to Cheyenne and Immigrants from Honduras by Householder Income Ages 25 - 44 years
In terms of householder income ages 25 - 44 years, the demographic groups most similar to Cheyenne are Ottawa ($79,012, a difference of 0.18%), African ($78,986, a difference of 0.21%), Menominee ($79,358, a difference of 0.26%), Immigrants from Haiti ($79,391, a difference of 0.30%), and U.S. Virgin Islander ($78,911, a difference of 0.30%). Similarly, the demographic groups most similar to Immigrants from Honduras are Dutch West Indian ($77,260, a difference of 0.090%), Sioux ($77,089, a difference of 0.31%), Houma ($77,044, a difference of 0.37%), Immigrants from Bahamas ($76,910, a difference of 0.54%), and Chickasaw ($77,929, a difference of 0.78%).
| Demographics | Rating | Rank | Householder Income Ages 25 - 44 years |
| Immigrants | Central America | 0.0 /100 | #308 | Tragic $80,012 |
| Chippewa | 0.0 /100 | #309 | Tragic $80,005 |
| Fijians | 0.0 /100 | #310 | Tragic $79,956 |
| Indonesians | 0.0 /100 | #311 | Tragic $79,543 |
| Immigrants | Haiti | 0.0 /100 | #312 | Tragic $79,391 |
| Menominee | 0.0 /100 | #313 | Tragic $79,358 |
| Cheyenne | 0.0 /100 | #314 | Tragic $79,152 |
| Ottawa | 0.0 /100 | #315 | Tragic $79,012 |
| Africans | 0.0 /100 | #316 | Tragic $78,986 |
| U.S. Virgin Islanders | 0.0 /100 | #317 | Tragic $78,911 |
| Immigrants | Mexico | 0.0 /100 | #318 | Tragic $78,809 |
| Hondurans | 0.0 /100 | #319 | Tragic $78,540 |
| Choctaw | 0.0 /100 | #320 | Tragic $78,168 |
| Immigrants | Zaire | 0.0 /100 | #321 | Tragic $78,045 |
| Chickasaw | 0.0 /100 | #322 | Tragic $77,929 |
| Immigrants | Honduras | 0.0 /100 | #323 | Tragic $77,328 |
| Dutch West Indians | 0.0 /100 | #324 | Tragic $77,260 |
| Sioux | 0.0 /100 | #325 | Tragic $77,089 |
| Houma | 0.0 /100 | #326 | Tragic $77,044 |
| Immigrants | Bahamas | 0.0 /100 | #327 | Tragic $76,910 |
| Immigrants | Cuba | 0.0 /100 | #328 | Tragic $76,701 |