Cheyenne vs Immigrants from Honduras Single Male Poverty
COMPARE
Cheyenne
Immigrants from Honduras
Single Male Poverty
Single Male Poverty Comparison
Cheyenne
Immigrants from Honduras
16.1%
SINGLE MALE POVERTY
0.0/ 100
METRIC RATING
315th/ 347
METRIC RANK
14.1%
SINGLE MALE POVERTY
0.0/ 100
METRIC RATING
277th/ 347
METRIC RANK
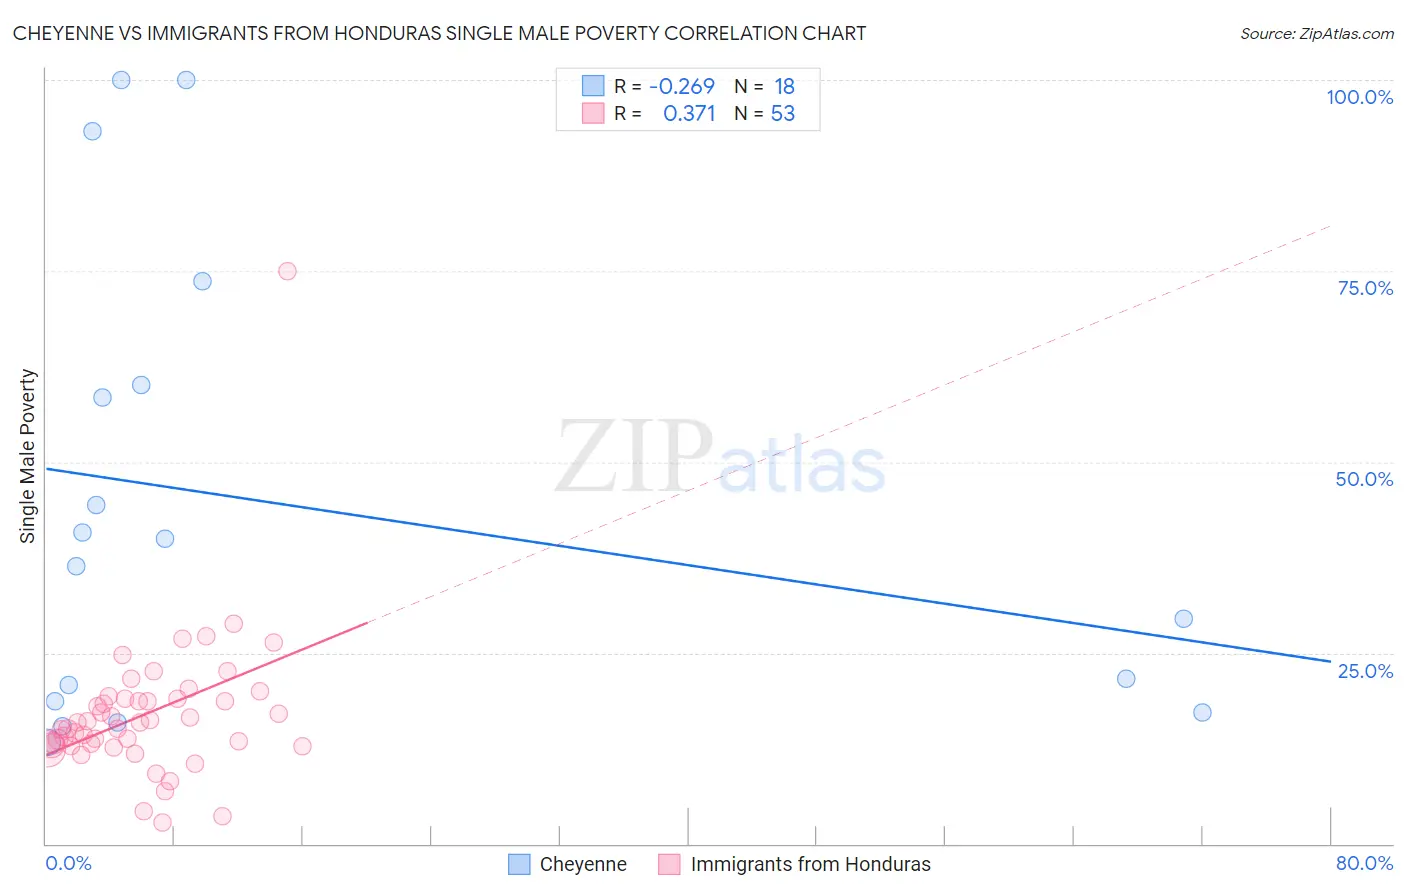
Cheyenne vs Immigrants from Honduras Single Male Poverty Correlation Chart
The statistical analysis conducted on geographies consisting of 78,255,059 people shows a weak negative correlation between the proportion of Cheyenne and poverty level among single males in the United States with a correlation coefficient (R) of -0.269 and weighted average of 16.1%. Similarly, the statistical analysis conducted on geographies consisting of 297,868,634 people shows a mild positive correlation between the proportion of Immigrants from Honduras and poverty level among single males in the United States with a correlation coefficient (R) of 0.371 and weighted average of 14.1%, a difference of 14.4%.
Single Male Poverty Correlation Summary
| Measurement | Cheyenne | Immigrants from Honduras |
| Minimum | 13.3% | 2.8% |
| Maximum | 100.0% | 75.0% |
| Range | 86.7% | 72.2% |
| Mean | 44.4% | 16.9% |
| Median | 38.2% | 15.8% |
| Interquartile 25% (IQ1) | 18.7% | 12.8% |
| Interquartile 75% (IQ3) | 60.0% | 19.0% |
| Interquartile Range (IQR) | 41.3% | 6.2% |
| Standard Deviation (Sample) | 30.0% | 9.9% |
| Standard Deviation (Population) | 29.1% | 9.8% |
Similar Demographics by Single Male Poverty
Demographics Similar to Cheyenne by Single Male Poverty
In terms of single male poverty, the demographic groups most similar to Cheyenne are Alaskan Athabascan (16.1%, a difference of 0.040%), Dutch West Indian (16.1%, a difference of 0.14%), Cherokee (16.1%, a difference of 0.33%), Black/African American (16.2%, a difference of 0.48%), and Comanche (16.0%, a difference of 0.56%).
| Demographics | Rating | Rank | Single Male Poverty |
| Potawatomi | 0.0 /100 | #308 | Tragic 15.8% |
| Americans | 0.0 /100 | #309 | Tragic 15.8% |
| Yakama | 0.0 /100 | #310 | Tragic 15.9% |
| Seminole | 0.0 /100 | #311 | Tragic 16.0% |
| Comanche | 0.0 /100 | #312 | Tragic 16.0% |
| Cherokee | 0.0 /100 | #313 | Tragic 16.1% |
| Alaskan Athabascans | 0.0 /100 | #314 | Tragic 16.1% |
| Cheyenne | 0.0 /100 | #315 | Tragic 16.1% |
| Dutch West Indians | 0.0 /100 | #316 | Tragic 16.1% |
| Blacks/African Americans | 0.0 /100 | #317 | Tragic 16.2% |
| Chickasaw | 0.0 /100 | #318 | Tragic 16.3% |
| Chippewa | 0.0 /100 | #319 | Tragic 16.4% |
| Marshallese | 0.0 /100 | #320 | Tragic 16.4% |
| Osage | 0.0 /100 | #321 | Tragic 16.5% |
| Shoshone | 0.0 /100 | #322 | Tragic 16.7% |
Demographics Similar to Immigrants from Honduras by Single Male Poverty
In terms of single male poverty, the demographic groups most similar to Immigrants from Honduras are Dutch (14.1%, a difference of 0.040%), Slovak (14.1%, a difference of 0.060%), Indonesian (14.1%, a difference of 0.10%), English (14.1%, a difference of 0.16%), and Honduran (14.0%, a difference of 0.23%).
| Demographics | Rating | Rank | Single Male Poverty |
| Immigrants | Saudi Arabia | 0.1 /100 | #270 | Tragic 14.0% |
| Irish | 0.1 /100 | #271 | Tragic 14.0% |
| Mexicans | 0.1 /100 | #272 | Tragic 14.0% |
| Welsh | 0.1 /100 | #273 | Tragic 14.0% |
| Hondurans | 0.1 /100 | #274 | Tragic 14.0% |
| English | 0.1 /100 | #275 | Tragic 14.1% |
| Dutch | 0.1 /100 | #276 | Tragic 14.1% |
| Immigrants | Honduras | 0.0 /100 | #277 | Tragic 14.1% |
| Slovaks | 0.0 /100 | #278 | Tragic 14.1% |
| Indonesians | 0.0 /100 | #279 | Tragic 14.1% |
| Hmong | 0.0 /100 | #280 | Tragic 14.2% |
| Hispanics or Latinos | 0.0 /100 | #281 | Tragic 14.2% |
| Spanish Americans | 0.0 /100 | #282 | Tragic 14.2% |
| Yaqui | 0.0 /100 | #283 | Tragic 14.2% |
| Immigrants | Bahamas | 0.0 /100 | #284 | Tragic 14.4% |