Soviet Union vs Immigrants from Argentina In Labor Force | Age 35-44
COMPARE
Soviet Union
Immigrants from Argentina
In Labor Force | Age 35-44
In Labor Force | Age 35-44 Comparison
Soviet Union
Immigrants from Argentina
85.1%
IN LABOR FORCE | AGE 35-44
99.5/ 100
METRIC RATING
55th/ 347
METRIC RANK
84.8%
IN LABOR FORCE | AGE 35-44
94.5/ 100
METRIC RATING
108th/ 347
METRIC RANK
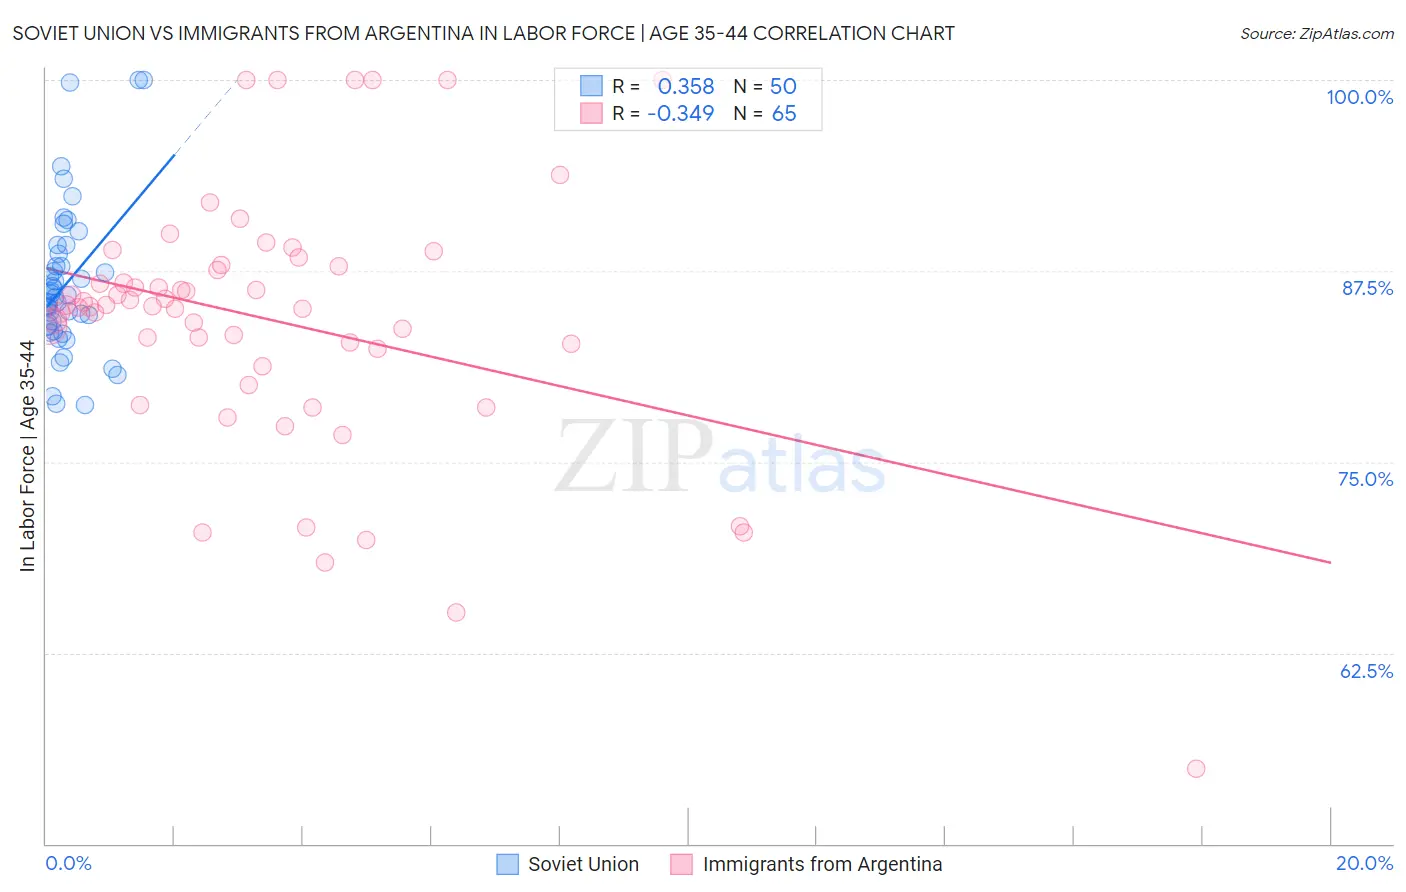
Soviet Union vs Immigrants from Argentina In Labor Force | Age 35-44 Correlation Chart
The statistical analysis conducted on geographies consisting of 43,512,203 people shows a mild positive correlation between the proportion of Soviet Union and labor force participation rate among population between the ages 35 and 44 in the United States with a correlation coefficient (R) of 0.358 and weighted average of 85.1%. Similarly, the statistical analysis conducted on geographies consisting of 264,372,085 people shows a mild negative correlation between the proportion of Immigrants from Argentina and labor force participation rate among population between the ages 35 and 44 in the United States with a correlation coefficient (R) of -0.349 and weighted average of 84.8%, a difference of 0.40%.
In Labor Force | Age 35-44 Correlation Summary
| Measurement | Soviet Union | Immigrants from Argentina |
| Minimum | 78.7% | 54.9% |
| Maximum | 100.0% | 100.0% |
| Range | 21.3% | 45.1% |
| Mean | 86.7% | 84.3% |
| Median | 85.8% | 85.2% |
| Interquartile 25% (IQ1) | 83.9% | 81.8% |
| Interquartile 75% (IQ3) | 88.6% | 87.8% |
| Interquartile Range (IQR) | 4.8% | 6.0% |
| Standard Deviation (Sample) | 4.8% | 8.5% |
| Standard Deviation (Population) | 4.8% | 8.4% |
Similar Demographics by In Labor Force | Age 35-44
Demographics Similar to Soviet Union by In Labor Force | Age 35-44
In terms of in labor force | age 35-44, the demographic groups most similar to Soviet Union are Turkish (85.1%, a difference of 0.0%), Immigrants from Croatia (85.1%, a difference of 0.010%), Taiwanese (85.1%, a difference of 0.020%), Immigrants from Kenya (85.1%, a difference of 0.030%), and Chinese (85.1%, a difference of 0.030%).
| Demographics | Rating | Rank | In Labor Force | Age 35-44 |
| Immigrants | Eritrea | 99.7 /100 | #48 | Exceptional 85.2% |
| Croatians | 99.7 /100 | #49 | Exceptional 85.2% |
| Thais | 99.7 /100 | #50 | Exceptional 85.2% |
| Immigrants | Albania | 99.7 /100 | #51 | Exceptional 85.1% |
| Immigrants | Kenya | 99.6 /100 | #52 | Exceptional 85.1% |
| Taiwanese | 99.6 /100 | #53 | Exceptional 85.1% |
| Turks | 99.5 /100 | #54 | Exceptional 85.1% |
| Soviet Union | 99.5 /100 | #55 | Exceptional 85.1% |
| Immigrants | Croatia | 99.5 /100 | #56 | Exceptional 85.1% |
| Chinese | 99.4 /100 | #57 | Exceptional 85.1% |
| Slovaks | 99.4 /100 | #58 | Exceptional 85.1% |
| Serbians | 99.4 /100 | #59 | Exceptional 85.1% |
| Albanians | 99.4 /100 | #60 | Exceptional 85.1% |
| Immigrants | Latvia | 99.3 /100 | #61 | Exceptional 85.0% |
| Immigrants | Moldova | 99.3 /100 | #62 | Exceptional 85.0% |
Demographics Similar to Immigrants from Argentina by In Labor Force | Age 35-44
In terms of in labor force | age 35-44, the demographic groups most similar to Immigrants from Argentina are Immigrants from Russia (84.8%, a difference of 0.0%), Immigrants from Bahamas (84.8%, a difference of 0.010%), Immigrants from Romania (84.8%, a difference of 0.010%), Immigrants from Belarus (84.8%, a difference of 0.020%), and Immigrants from Sweden (84.8%, a difference of 0.020%).
| Demographics | Rating | Rank | In Labor Force | Age 35-44 |
| Immigrants | Australia | 95.5 /100 | #101 | Exceptional 84.8% |
| Immigrants | Southern Europe | 95.3 /100 | #102 | Exceptional 84.8% |
| Immigrants | Belarus | 95.3 /100 | #103 | Exceptional 84.8% |
| Immigrants | Sweden | 95.2 /100 | #104 | Exceptional 84.8% |
| South Americans | 95.0 /100 | #105 | Exceptional 84.8% |
| Immigrants | Bahamas | 94.8 /100 | #106 | Exceptional 84.8% |
| Immigrants | Romania | 94.7 /100 | #107 | Exceptional 84.8% |
| Immigrants | Argentina | 94.5 /100 | #108 | Exceptional 84.8% |
| Immigrants | Russia | 94.5 /100 | #109 | Exceptional 84.8% |
| Filipinos | 93.8 /100 | #110 | Exceptional 84.7% |
| Ukrainians | 93.5 /100 | #111 | Exceptional 84.7% |
| Immigrants | Western Africa | 93.4 /100 | #112 | Exceptional 84.7% |
| Uruguayans | 93.3 /100 | #113 | Exceptional 84.7% |
| Chileans | 93.2 /100 | #114 | Exceptional 84.7% |
| Bahamians | 93.2 /100 | #115 | Exceptional 84.7% |