Central American Indian vs Swiss In Labor Force | Age 45-54
COMPARE
Central American Indian
Swiss
In Labor Force | Age 45-54
In Labor Force | Age 45-54 Comparison
Central American Indians
Swiss
80.0%
IN LABOR FORCE | AGE 45-54
0.0/ 100
METRIC RATING
308th/ 347
METRIC RANK
82.8%
IN LABOR FORCE | AGE 45-54
56.5/ 100
METRIC RATING
167th/ 347
METRIC RANK
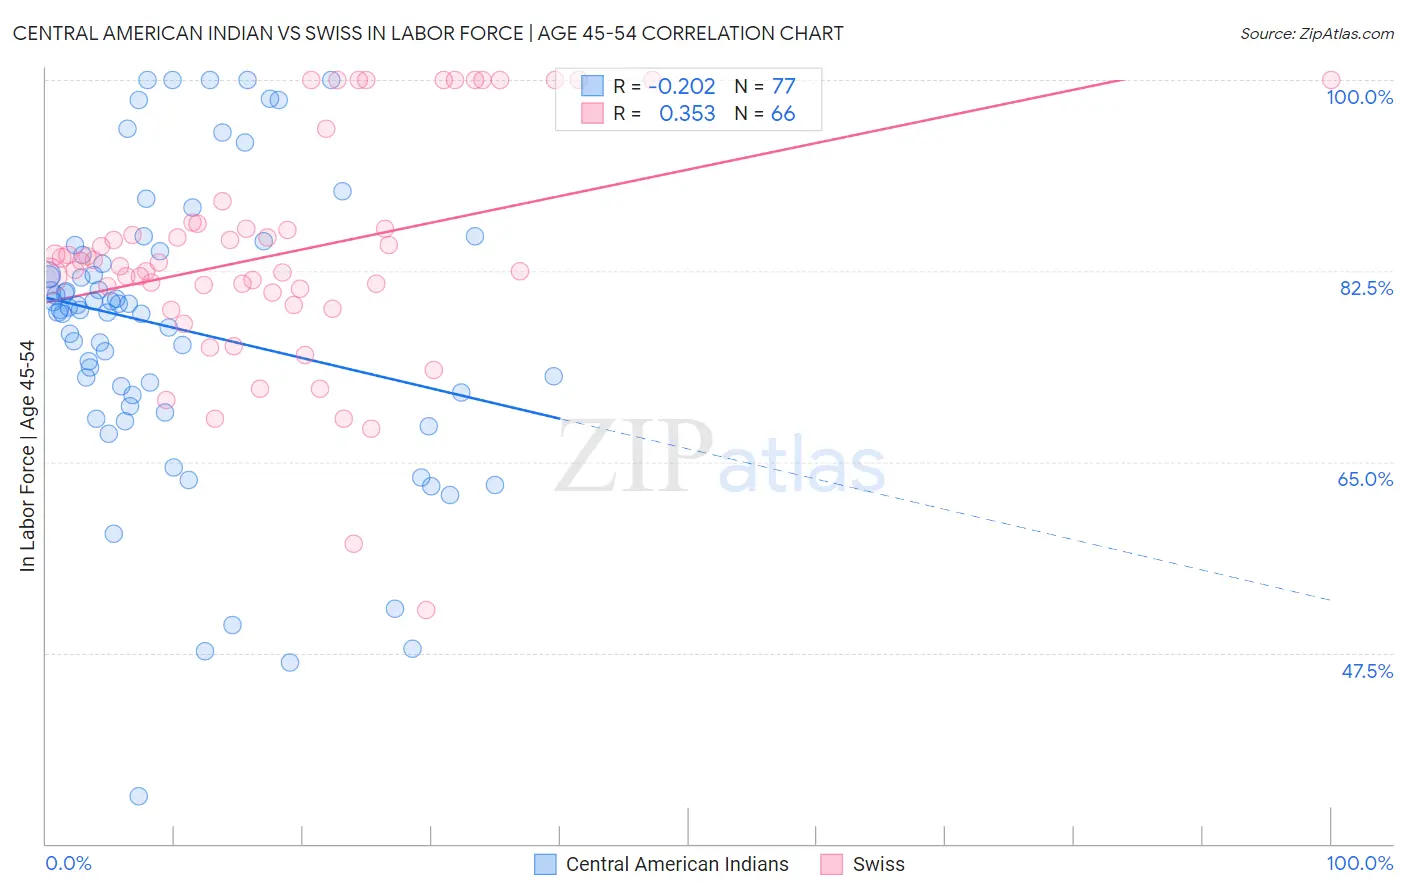
Central American Indian vs Swiss In Labor Force | Age 45-54 Correlation Chart
The statistical analysis conducted on geographies consisting of 326,071,382 people shows a weak negative correlation between the proportion of Central American Indians and labor force participation rate among population between the ages 45 and 54 in the United States with a correlation coefficient (R) of -0.202 and weighted average of 80.0%. Similarly, the statistical analysis conducted on geographies consisting of 464,737,366 people shows a mild positive correlation between the proportion of Swiss and labor force participation rate among population between the ages 45 and 54 in the United States with a correlation coefficient (R) of 0.353 and weighted average of 82.8%, a difference of 3.5%.
In Labor Force | Age 45-54 Correlation Summary
| Measurement | Central American Indian | Swiss |
| Minimum | 34.3% | 51.4% |
| Maximum | 100.0% | 100.0% |
| Range | 65.7% | 48.6% |
| Mean | 77.2% | 84.1% |
| Median | 78.9% | 83.4% |
| Interquartile 25% (IQ1) | 70.6% | 80.5% |
| Interquartile 75% (IQ3) | 84.1% | 86.8% |
| Interquartile Range (IQR) | 13.5% | 6.3% |
| Standard Deviation (Sample) | 13.6% | 10.4% |
| Standard Deviation (Population) | 13.5% | 10.3% |
Similar Demographics by In Labor Force | Age 45-54
Demographics Similar to Central American Indians by In Labor Force | Age 45-54
In terms of in labor force | age 45-54, the demographic groups most similar to Central American Indians are Potawatomi (80.0%, a difference of 0.030%), Blackfeet (80.0%, a difference of 0.040%), Spanish American (80.1%, a difference of 0.12%), Inupiat (79.9%, a difference of 0.12%), and Hispanic or Latino (80.1%, a difference of 0.16%).
| Demographics | Rating | Rank | In Labor Force | Age 45-54 |
| Spanish American Indians | 0.0 /100 | #301 | Tragic 80.2% |
| Immigrants | Central America | 0.0 /100 | #302 | Tragic 80.2% |
| Immigrants | Azores | 0.0 /100 | #303 | Tragic 80.1% |
| Hispanics or Latinos | 0.0 /100 | #304 | Tragic 80.1% |
| Immigrants | Dominican Republic | 0.0 /100 | #305 | Tragic 80.1% |
| Spanish Americans | 0.0 /100 | #306 | Tragic 80.1% |
| Blackfeet | 0.0 /100 | #307 | Tragic 80.0% |
| Central American Indians | 0.0 /100 | #308 | Tragic 80.0% |
| Potawatomi | 0.0 /100 | #309 | Tragic 80.0% |
| Inupiat | 0.0 /100 | #310 | Tragic 79.9% |
| Mexicans | 0.0 /100 | #311 | Tragic 79.8% |
| Immigrants | Mexico | 0.0 /100 | #312 | Tragic 79.7% |
| Colville | 0.0 /100 | #313 | Tragic 79.5% |
| Ottawa | 0.0 /100 | #314 | Tragic 79.5% |
| Blacks/African Americans | 0.0 /100 | #315 | Tragic 79.3% |
Demographics Similar to Swiss by In Labor Force | Age 45-54
In terms of in labor force | age 45-54, the demographic groups most similar to Swiss are Immigrants from South Eastern Asia (82.8%, a difference of 0.010%), Immigrants from South Africa (82.8%, a difference of 0.010%), Immigrants from Western Africa (82.8%, a difference of 0.020%), Immigrants from Sudan (82.8%, a difference of 0.030%), and Pakistani (82.8%, a difference of 0.030%).
| Demographics | Rating | Rank | In Labor Force | Age 45-54 |
| Laotians | 62.8 /100 | #160 | Good 82.9% |
| South American Indians | 62.2 /100 | #161 | Good 82.9% |
| Haitians | 61.8 /100 | #162 | Good 82.8% |
| Dutch | 61.7 /100 | #163 | Good 82.8% |
| German Russians | 61.3 /100 | #164 | Good 82.8% |
| Immigrants | Sudan | 59.9 /100 | #165 | Average 82.8% |
| Immigrants | South Eastern Asia | 57.4 /100 | #166 | Average 82.8% |
| Swiss | 56.5 /100 | #167 | Average 82.8% |
| Immigrants | South Africa | 55.8 /100 | #168 | Average 82.8% |
| Immigrants | Western Africa | 54.1 /100 | #169 | Average 82.8% |
| Pakistanis | 53.2 /100 | #170 | Average 82.8% |
| Immigrants | Zaire | 52.9 /100 | #171 | Average 82.8% |
| Icelanders | 51.8 /100 | #172 | Average 82.8% |
| Nicaraguans | 50.3 /100 | #173 | Average 82.8% |
| Costa Ricans | 50.0 /100 | #174 | Average 82.8% |