Central American Indian vs Immigrants from Senegal In Labor Force | Age 45-54
COMPARE
Central American Indian
Immigrants from Senegal
In Labor Force | Age 45-54
In Labor Force | Age 45-54 Comparison
Central American Indians
Immigrants from Senegal
80.0%
IN LABOR FORCE | AGE 45-54
0.0/ 100
METRIC RATING
308th/ 347
METRIC RANK
82.0%
IN LABOR FORCE | AGE 45-54
1.7/ 100
METRIC RATING
231st/ 347
METRIC RANK
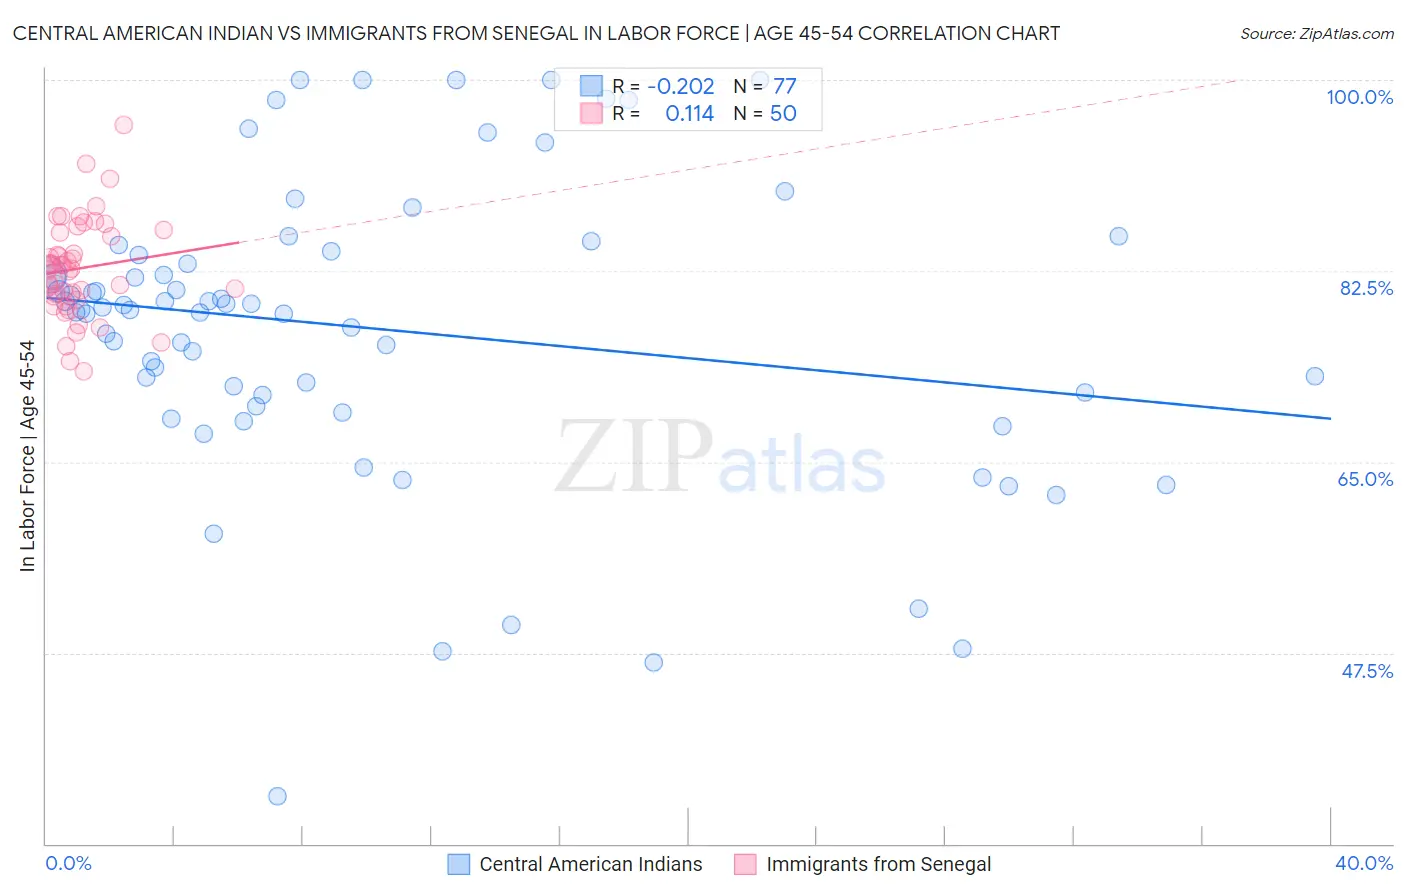
Central American Indian vs Immigrants from Senegal In Labor Force | Age 45-54 Correlation Chart
The statistical analysis conducted on geographies consisting of 326,071,382 people shows a weak negative correlation between the proportion of Central American Indians and labor force participation rate among population between the ages 45 and 54 in the United States with a correlation coefficient (R) of -0.202 and weighted average of 80.0%. Similarly, the statistical analysis conducted on geographies consisting of 90,120,202 people shows a poor positive correlation between the proportion of Immigrants from Senegal and labor force participation rate among population between the ages 45 and 54 in the United States with a correlation coefficient (R) of 0.114 and weighted average of 82.0%, a difference of 2.6%.
In Labor Force | Age 45-54 Correlation Summary
| Measurement | Central American Indian | Immigrants from Senegal |
| Minimum | 34.3% | 73.3% |
| Maximum | 100.0% | 95.9% |
| Range | 65.7% | 22.6% |
| Mean | 77.2% | 82.7% |
| Median | 78.9% | 82.9% |
| Interquartile 25% (IQ1) | 70.6% | 80.2% |
| Interquartile 75% (IQ3) | 84.1% | 86.1% |
| Interquartile Range (IQR) | 13.5% | 5.9% |
| Standard Deviation (Sample) | 13.6% | 4.5% |
| Standard Deviation (Population) | 13.5% | 4.5% |
Similar Demographics by In Labor Force | Age 45-54
Demographics Similar to Central American Indians by In Labor Force | Age 45-54
In terms of in labor force | age 45-54, the demographic groups most similar to Central American Indians are Potawatomi (80.0%, a difference of 0.030%), Blackfeet (80.0%, a difference of 0.040%), Spanish American (80.1%, a difference of 0.12%), Inupiat (79.9%, a difference of 0.12%), and Hispanic or Latino (80.1%, a difference of 0.16%).
| Demographics | Rating | Rank | In Labor Force | Age 45-54 |
| Spanish American Indians | 0.0 /100 | #301 | Tragic 80.2% |
| Immigrants | Central America | 0.0 /100 | #302 | Tragic 80.2% |
| Immigrants | Azores | 0.0 /100 | #303 | Tragic 80.1% |
| Hispanics or Latinos | 0.0 /100 | #304 | Tragic 80.1% |
| Immigrants | Dominican Republic | 0.0 /100 | #305 | Tragic 80.1% |
| Spanish Americans | 0.0 /100 | #306 | Tragic 80.1% |
| Blackfeet | 0.0 /100 | #307 | Tragic 80.0% |
| Central American Indians | 0.0 /100 | #308 | Tragic 80.0% |
| Potawatomi | 0.0 /100 | #309 | Tragic 80.0% |
| Inupiat | 0.0 /100 | #310 | Tragic 79.9% |
| Mexicans | 0.0 /100 | #311 | Tragic 79.8% |
| Immigrants | Mexico | 0.0 /100 | #312 | Tragic 79.7% |
| Colville | 0.0 /100 | #313 | Tragic 79.5% |
| Ottawa | 0.0 /100 | #314 | Tragic 79.5% |
| Blacks/African Americans | 0.0 /100 | #315 | Tragic 79.3% |
Demographics Similar to Immigrants from Senegal by In Labor Force | Age 45-54
In terms of in labor force | age 45-54, the demographic groups most similar to Immigrants from Senegal are Immigrants from Portugal (82.0%, a difference of 0.0%), Jamaican (82.0%, a difference of 0.010%), Malaysian (82.0%, a difference of 0.010%), Salvadoran (82.0%, a difference of 0.010%), and Immigrants from Burma/Myanmar (82.0%, a difference of 0.030%).
| Demographics | Rating | Rank | In Labor Force | Age 45-54 |
| Immigrants | Jamaica | 2.7 /100 | #224 | Tragic 82.1% |
| Immigrants | Oceania | 2.5 /100 | #225 | Tragic 82.1% |
| Immigrants | Caribbean | 2.5 /100 | #226 | Tragic 82.1% |
| Immigrants | Germany | 2.4 /100 | #227 | Tragic 82.1% |
| Cape Verdeans | 2.1 /100 | #228 | Tragic 82.1% |
| Immigrants | Burma/Myanmar | 1.9 /100 | #229 | Tragic 82.0% |
| Jamaicans | 1.8 /100 | #230 | Tragic 82.0% |
| Immigrants | Senegal | 1.7 /100 | #231 | Tragic 82.0% |
| Immigrants | Portugal | 1.7 /100 | #232 | Tragic 82.0% |
| Malaysians | 1.7 /100 | #233 | Tragic 82.0% |
| Salvadorans | 1.7 /100 | #234 | Tragic 82.0% |
| Sub-Saharan Africans | 1.2 /100 | #235 | Tragic 82.0% |
| Basques | 1.2 /100 | #236 | Tragic 82.0% |
| Immigrants | Trinidad and Tobago | 1.2 /100 | #237 | Tragic 82.0% |
| Trinidadians and Tobagonians | 1.1 /100 | #238 | Tragic 81.9% |