Immigrants from India vs Swiss In Labor Force | Age 45-54
COMPARE
Immigrants from India
Swiss
In Labor Force | Age 45-54
In Labor Force | Age 45-54 Comparison
Immigrants from India
Swiss
84.7%
IN LABOR FORCE | AGE 45-54
100.0/ 100
METRIC RATING
6th/ 347
METRIC RANK
82.8%
IN LABOR FORCE | AGE 45-54
56.5/ 100
METRIC RATING
167th/ 347
METRIC RANK
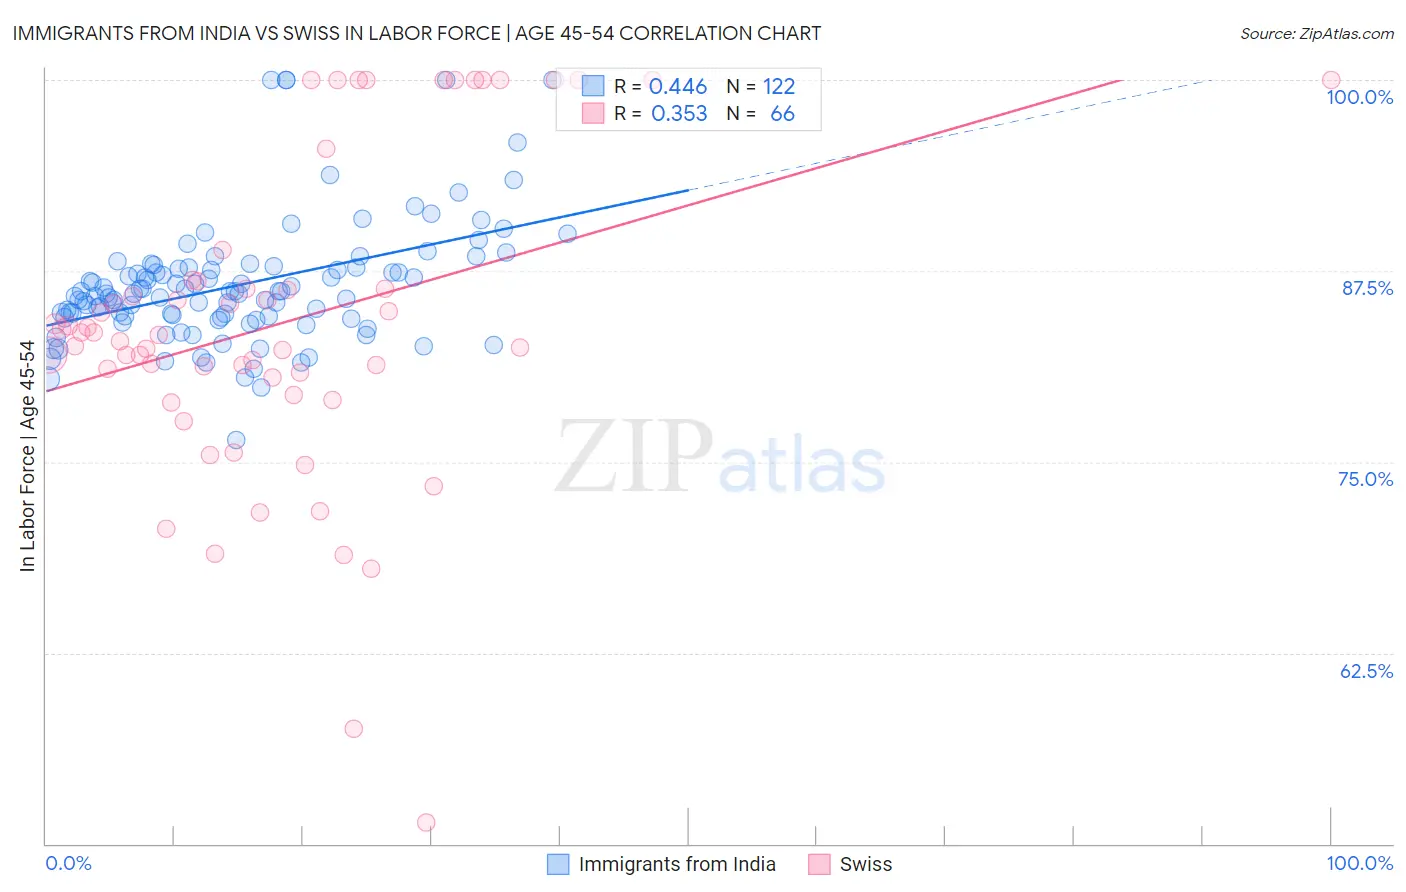
Immigrants from India vs Swiss In Labor Force | Age 45-54 Correlation Chart
The statistical analysis conducted on geographies consisting of 433,718,001 people shows a moderate positive correlation between the proportion of Immigrants from India and labor force participation rate among population between the ages 45 and 54 in the United States with a correlation coefficient (R) of 0.446 and weighted average of 84.7%. Similarly, the statistical analysis conducted on geographies consisting of 464,737,366 people shows a mild positive correlation between the proportion of Swiss and labor force participation rate among population between the ages 45 and 54 in the United States with a correlation coefficient (R) of 0.353 and weighted average of 82.8%, a difference of 2.2%.
In Labor Force | Age 45-54 Correlation Summary
| Measurement | Immigrants from India | Swiss |
| Minimum | 76.4% | 51.4% |
| Maximum | 100.0% | 100.0% |
| Range | 23.6% | 48.6% |
| Mean | 86.5% | 84.1% |
| Median | 86.0% | 83.4% |
| Interquartile 25% (IQ1) | 84.5% | 80.5% |
| Interquartile 75% (IQ3) | 87.7% | 86.8% |
| Interquartile Range (IQR) | 3.2% | 6.3% |
| Standard Deviation (Sample) | 4.0% | 10.4% |
| Standard Deviation (Population) | 4.0% | 10.3% |
Similar Demographics by In Labor Force | Age 45-54
Demographics Similar to Immigrants from India by In Labor Force | Age 45-54
In terms of in labor force | age 45-54, the demographic groups most similar to Immigrants from India are Immigrants from Cameroon (84.6%, a difference of 0.070%), Ethiopian (84.8%, a difference of 0.11%), Sierra Leonean (84.5%, a difference of 0.18%), Immigrants from Ethiopia (84.8%, a difference of 0.19%), and Immigrants from Sierra Leone (84.4%, a difference of 0.28%).
| Demographics | Rating | Rank | In Labor Force | Age 45-54 |
| Immigrants | Bolivia | 100.0 /100 | #1 | Exceptional 85.3% |
| Luxembourgers | 100.0 /100 | #2 | Exceptional 85.0% |
| Bolivians | 100.0 /100 | #3 | Exceptional 84.9% |
| Immigrants | Ethiopia | 100.0 /100 | #4 | Exceptional 84.8% |
| Ethiopians | 100.0 /100 | #5 | Exceptional 84.8% |
| Immigrants | India | 100.0 /100 | #6 | Exceptional 84.7% |
| Immigrants | Cameroon | 100.0 /100 | #7 | Exceptional 84.6% |
| Sierra Leoneans | 100.0 /100 | #8 | Exceptional 84.5% |
| Immigrants | Sierra Leone | 100.0 /100 | #9 | Exceptional 84.4% |
| Norwegians | 100.0 /100 | #10 | Exceptional 84.4% |
| Thais | 100.0 /100 | #11 | Exceptional 84.3% |
| Bulgarians | 100.0 /100 | #12 | Exceptional 84.2% |
| Chinese | 99.9 /100 | #13 | Exceptional 84.1% |
| Cambodians | 99.9 /100 | #14 | Exceptional 84.1% |
| Cypriots | 99.9 /100 | #15 | Exceptional 84.1% |
Demographics Similar to Swiss by In Labor Force | Age 45-54
In terms of in labor force | age 45-54, the demographic groups most similar to Swiss are Immigrants from South Eastern Asia (82.8%, a difference of 0.010%), Immigrants from South Africa (82.8%, a difference of 0.010%), Immigrants from Western Africa (82.8%, a difference of 0.020%), Immigrants from Sudan (82.8%, a difference of 0.030%), and Pakistani (82.8%, a difference of 0.030%).
| Demographics | Rating | Rank | In Labor Force | Age 45-54 |
| Laotians | 62.8 /100 | #160 | Good 82.9% |
| South American Indians | 62.2 /100 | #161 | Good 82.9% |
| Haitians | 61.8 /100 | #162 | Good 82.8% |
| Dutch | 61.7 /100 | #163 | Good 82.8% |
| German Russians | 61.3 /100 | #164 | Good 82.8% |
| Immigrants | Sudan | 59.9 /100 | #165 | Average 82.8% |
| Immigrants | South Eastern Asia | 57.4 /100 | #166 | Average 82.8% |
| Swiss | 56.5 /100 | #167 | Average 82.8% |
| Immigrants | South Africa | 55.8 /100 | #168 | Average 82.8% |
| Immigrants | Western Africa | 54.1 /100 | #169 | Average 82.8% |
| Pakistanis | 53.2 /100 | #170 | Average 82.8% |
| Immigrants | Zaire | 52.9 /100 | #171 | Average 82.8% |
| Icelanders | 51.8 /100 | #172 | Average 82.8% |
| Nicaraguans | 50.3 /100 | #173 | Average 82.8% |
| Costa Ricans | 50.0 /100 | #174 | Average 82.8% |