Immigrants from Barbados vs Swiss In Labor Force | Age 45-54
COMPARE
Immigrants from Barbados
Swiss
In Labor Force | Age 45-54
In Labor Force | Age 45-54 Comparison
Immigrants from Barbados
Swiss
81.3%
IN LABOR FORCE | AGE 45-54
0.0/ 100
METRIC RATING
271st/ 347
METRIC RANK
82.8%
IN LABOR FORCE | AGE 45-54
56.5/ 100
METRIC RATING
167th/ 347
METRIC RANK
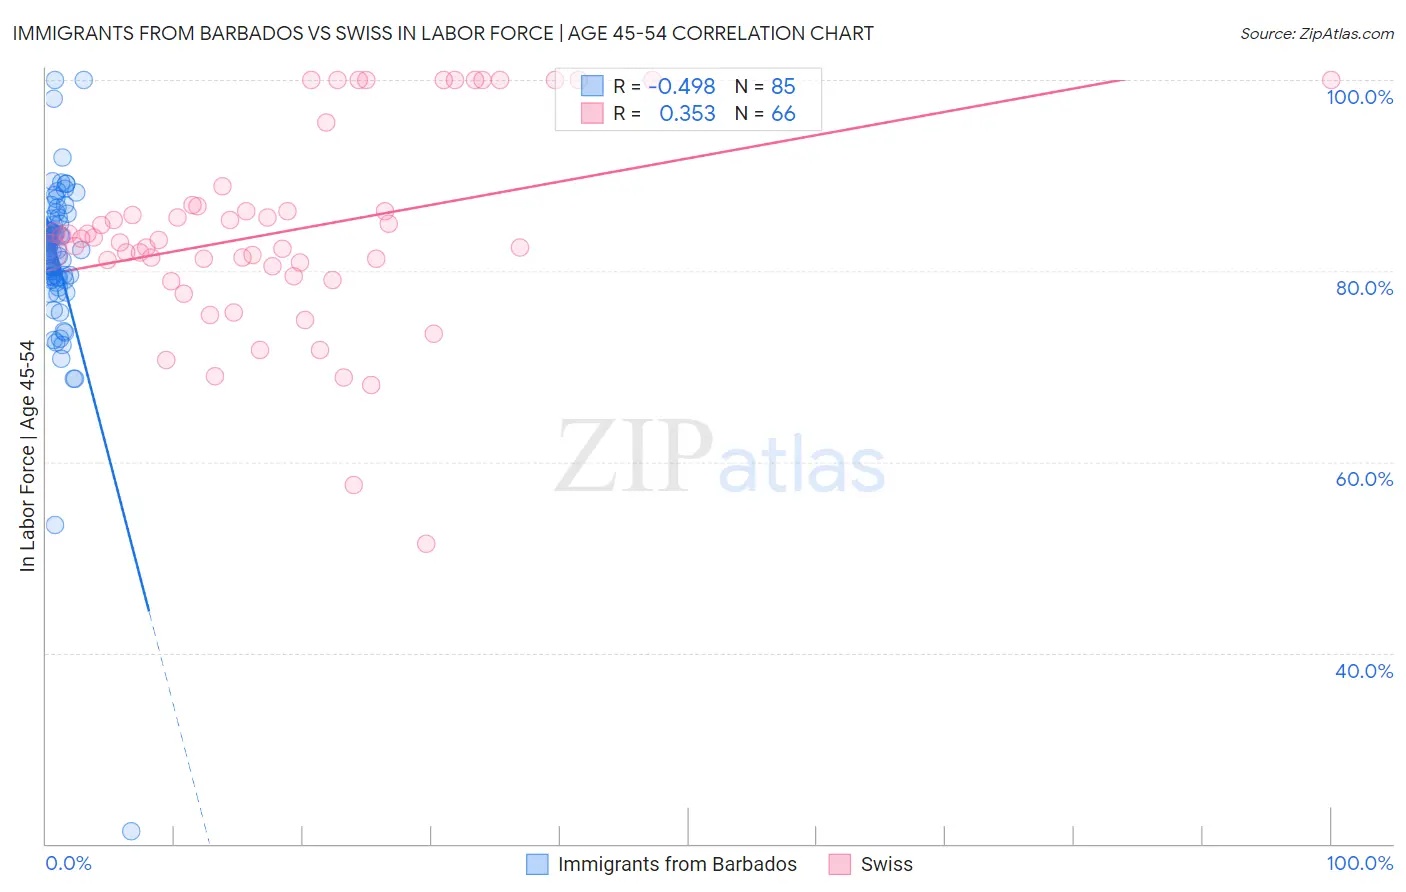
Immigrants from Barbados vs Swiss In Labor Force | Age 45-54 Correlation Chart
The statistical analysis conducted on geographies consisting of 112,763,171 people shows a moderate negative correlation between the proportion of Immigrants from Barbados and labor force participation rate among population between the ages 45 and 54 in the United States with a correlation coefficient (R) of -0.498 and weighted average of 81.3%. Similarly, the statistical analysis conducted on geographies consisting of 464,737,366 people shows a mild positive correlation between the proportion of Swiss and labor force participation rate among population between the ages 45 and 54 in the United States with a correlation coefficient (R) of 0.353 and weighted average of 82.8%, a difference of 1.8%.
In Labor Force | Age 45-54 Correlation Summary
| Measurement | Immigrants from Barbados | Swiss |
| Minimum | 21.3% | 51.4% |
| Maximum | 100.0% | 100.0% |
| Range | 78.7% | 48.6% |
| Mean | 81.2% | 84.1% |
| Median | 82.2% | 83.4% |
| Interquartile 25% (IQ1) | 79.3% | 80.5% |
| Interquartile 75% (IQ3) | 84.9% | 86.8% |
| Interquartile Range (IQR) | 5.6% | 6.3% |
| Standard Deviation (Sample) | 9.3% | 10.4% |
| Standard Deviation (Population) | 9.2% | 10.3% |
Similar Demographics by In Labor Force | Age 45-54
Demographics Similar to Immigrants from Barbados by In Labor Force | Age 45-54
In terms of in labor force | age 45-54, the demographic groups most similar to Immigrants from Barbados are Bangladeshi (81.3%, a difference of 0.010%), Spanish (81.3%, a difference of 0.010%), Alsatian (81.3%, a difference of 0.040%), Immigrants from Honduras (81.4%, a difference of 0.060%), and Chippewa (81.3%, a difference of 0.070%).
| Demographics | Rating | Rank | In Labor Force | Age 45-54 |
| Immigrants | West Indies | 0.1 /100 | #264 | Tragic 81.5% |
| Hondurans | 0.1 /100 | #265 | Tragic 81.4% |
| Immigrants | St. Vincent and the Grenadines | 0.1 /100 | #266 | Tragic 81.4% |
| West Indians | 0.1 /100 | #267 | Tragic 81.4% |
| Immigrants | Honduras | 0.0 /100 | #268 | Tragic 81.4% |
| Alsatians | 0.0 /100 | #269 | Tragic 81.3% |
| Bangladeshis | 0.0 /100 | #270 | Tragic 81.3% |
| Immigrants | Barbados | 0.0 /100 | #271 | Tragic 81.3% |
| Spanish | 0.0 /100 | #272 | Tragic 81.3% |
| Chippewa | 0.0 /100 | #273 | Tragic 81.3% |
| British West Indians | 0.0 /100 | #274 | Tragic 81.2% |
| Immigrants | Nonimmigrants | 0.0 /100 | #275 | Tragic 81.2% |
| U.S. Virgin Islanders | 0.0 /100 | #276 | Tragic 81.2% |
| Guatemalans | 0.0 /100 | #277 | Tragic 81.2% |
| Immigrants | Guatemala | 0.0 /100 | #278 | Tragic 81.1% |
Demographics Similar to Swiss by In Labor Force | Age 45-54
In terms of in labor force | age 45-54, the demographic groups most similar to Swiss are Immigrants from South Eastern Asia (82.8%, a difference of 0.010%), Immigrants from South Africa (82.8%, a difference of 0.010%), Immigrants from Western Africa (82.8%, a difference of 0.020%), Immigrants from Sudan (82.8%, a difference of 0.030%), and Pakistani (82.8%, a difference of 0.030%).
| Demographics | Rating | Rank | In Labor Force | Age 45-54 |
| Laotians | 62.8 /100 | #160 | Good 82.9% |
| South American Indians | 62.2 /100 | #161 | Good 82.9% |
| Haitians | 61.8 /100 | #162 | Good 82.8% |
| Dutch | 61.7 /100 | #163 | Good 82.8% |
| German Russians | 61.3 /100 | #164 | Good 82.8% |
| Immigrants | Sudan | 59.9 /100 | #165 | Average 82.8% |
| Immigrants | South Eastern Asia | 57.4 /100 | #166 | Average 82.8% |
| Swiss | 56.5 /100 | #167 | Average 82.8% |
| Immigrants | South Africa | 55.8 /100 | #168 | Average 82.8% |
| Immigrants | Western Africa | 54.1 /100 | #169 | Average 82.8% |
| Pakistanis | 53.2 /100 | #170 | Average 82.8% |
| Immigrants | Zaire | 52.9 /100 | #171 | Average 82.8% |
| Icelanders | 51.8 /100 | #172 | Average 82.8% |
| Nicaraguans | 50.3 /100 | #173 | Average 82.8% |
| Costa Ricans | 50.0 /100 | #174 | Average 82.8% |