Tongan vs Swiss In Labor Force | Age 45-54
COMPARE
Tongan
Swiss
In Labor Force | Age 45-54
In Labor Force | Age 45-54 Comparison
Tongans
Swiss
83.1%
IN LABOR FORCE | AGE 45-54
88.2/ 100
METRIC RATING
123rd/ 347
METRIC RANK
82.8%
IN LABOR FORCE | AGE 45-54
56.5/ 100
METRIC RATING
167th/ 347
METRIC RANK
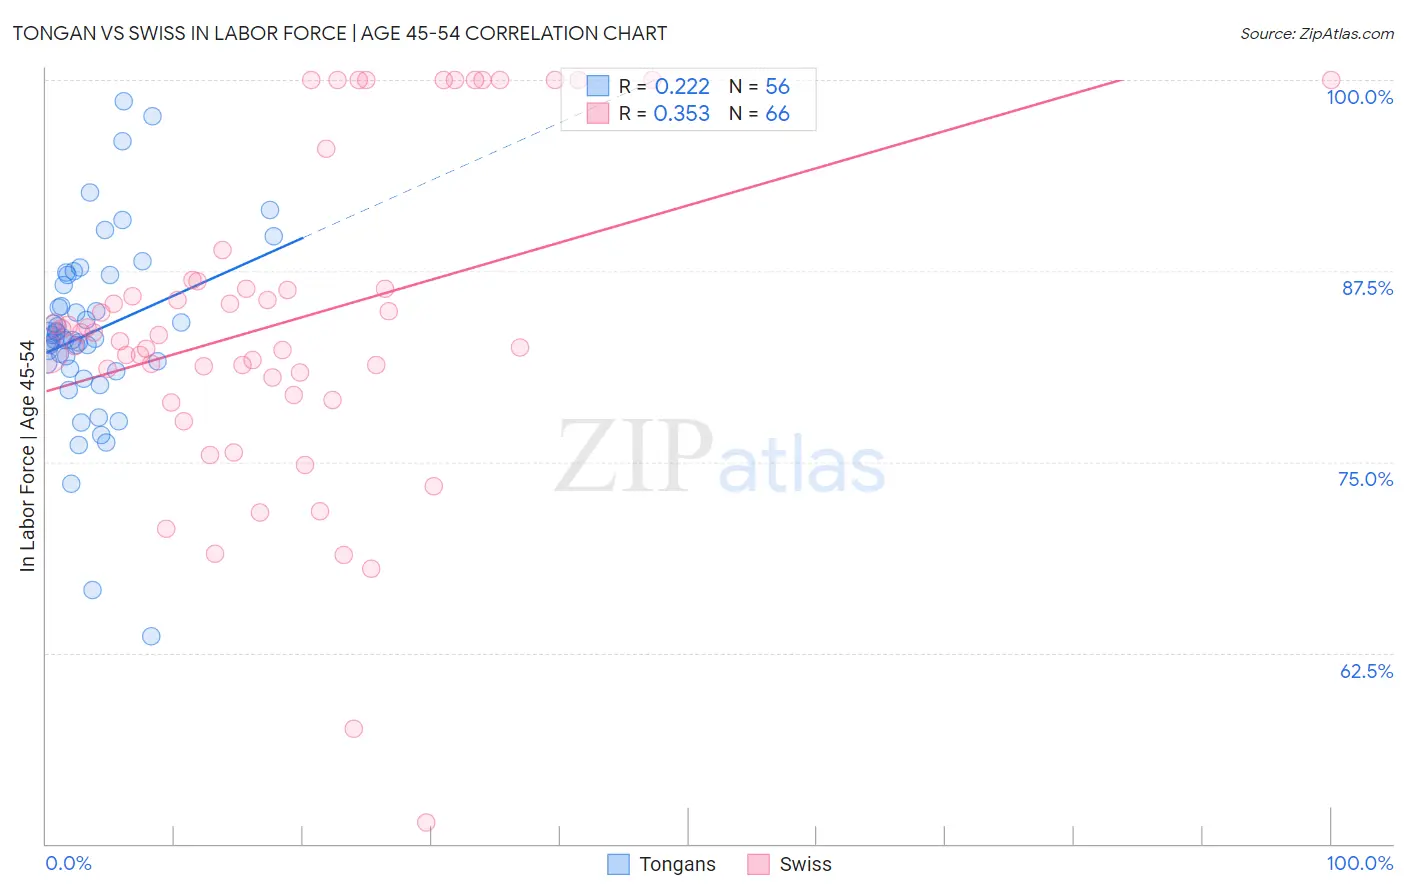
Tongan vs Swiss In Labor Force | Age 45-54 Correlation Chart
The statistical analysis conducted on geographies consisting of 102,866,719 people shows a weak positive correlation between the proportion of Tongans and labor force participation rate among population between the ages 45 and 54 in the United States with a correlation coefficient (R) of 0.222 and weighted average of 83.1%. Similarly, the statistical analysis conducted on geographies consisting of 464,737,366 people shows a mild positive correlation between the proportion of Swiss and labor force participation rate among population between the ages 45 and 54 in the United States with a correlation coefficient (R) of 0.353 and weighted average of 82.8%, a difference of 0.39%.
In Labor Force | Age 45-54 Correlation Summary
| Measurement | Tongan | Swiss |
| Minimum | 63.6% | 51.4% |
| Maximum | 98.6% | 100.0% |
| Range | 35.0% | 48.6% |
| Mean | 83.5% | 84.1% |
| Median | 83.1% | 83.4% |
| Interquartile 25% (IQ1) | 81.3% | 80.5% |
| Interquartile 75% (IQ3) | 86.9% | 86.8% |
| Interquartile Range (IQR) | 5.6% | 6.3% |
| Standard Deviation (Sample) | 6.2% | 10.4% |
| Standard Deviation (Population) | 6.1% | 10.3% |
Similar Demographics by In Labor Force | Age 45-54
Demographics Similar to Tongans by In Labor Force | Age 45-54
In terms of in labor force | age 45-54, the demographic groups most similar to Tongans are Bermudan (83.1%, a difference of 0.0%), Immigrants from Vietnam (83.1%, a difference of 0.010%), Uruguayan (83.1%, a difference of 0.020%), Immigrants from Iran (83.1%, a difference of 0.020%), and Immigrants from Uruguay (83.2%, a difference of 0.040%).
| Demographics | Rating | Rank | In Labor Force | Age 45-54 |
| Immigrants | Malaysia | 91.4 /100 | #116 | Exceptional 83.2% |
| Immigrants | China | 90.9 /100 | #117 | Exceptional 83.2% |
| Immigrants | Europe | 90.7 /100 | #118 | Exceptional 83.2% |
| Immigrants | Uruguay | 90.2 /100 | #119 | Exceptional 83.2% |
| Immigrants | Russia | 90.1 /100 | #120 | Exceptional 83.2% |
| Uruguayans | 89.4 /100 | #121 | Excellent 83.1% |
| Immigrants | Vietnam | 88.9 /100 | #122 | Excellent 83.1% |
| Tongans | 88.2 /100 | #123 | Excellent 83.1% |
| Bermudans | 88.0 /100 | #124 | Excellent 83.1% |
| Immigrants | Iran | 87.2 /100 | #125 | Excellent 83.1% |
| Immigrants | Belgium | 86.4 /100 | #126 | Excellent 83.1% |
| Immigrants | Jordan | 85.2 /100 | #127 | Excellent 83.1% |
| Germans | 85.1 /100 | #128 | Excellent 83.1% |
| Immigrants | Northern Europe | 85.1 /100 | #129 | Excellent 83.1% |
| Immigrants | Israel | 84.7 /100 | #130 | Excellent 83.1% |
Demographics Similar to Swiss by In Labor Force | Age 45-54
In terms of in labor force | age 45-54, the demographic groups most similar to Swiss are Immigrants from South Eastern Asia (82.8%, a difference of 0.010%), Immigrants from South Africa (82.8%, a difference of 0.010%), Immigrants from Western Africa (82.8%, a difference of 0.020%), Immigrants from Sudan (82.8%, a difference of 0.030%), and Pakistani (82.8%, a difference of 0.030%).
| Demographics | Rating | Rank | In Labor Force | Age 45-54 |
| Laotians | 62.8 /100 | #160 | Good 82.9% |
| South American Indians | 62.2 /100 | #161 | Good 82.9% |
| Haitians | 61.8 /100 | #162 | Good 82.8% |
| Dutch | 61.7 /100 | #163 | Good 82.8% |
| German Russians | 61.3 /100 | #164 | Good 82.8% |
| Immigrants | Sudan | 59.9 /100 | #165 | Average 82.8% |
| Immigrants | South Eastern Asia | 57.4 /100 | #166 | Average 82.8% |
| Swiss | 56.5 /100 | #167 | Average 82.8% |
| Immigrants | South Africa | 55.8 /100 | #168 | Average 82.8% |
| Immigrants | Western Africa | 54.1 /100 | #169 | Average 82.8% |
| Pakistanis | 53.2 /100 | #170 | Average 82.8% |
| Immigrants | Zaire | 52.9 /100 | #171 | Average 82.8% |
| Icelanders | 51.8 /100 | #172 | Average 82.8% |
| Nicaraguans | 50.3 /100 | #173 | Average 82.8% |
| Costa Ricans | 50.0 /100 | #174 | Average 82.8% |