Central American Indian vs Immigrants from Barbados In Labor Force | Age 45-54
COMPARE
Central American Indian
Immigrants from Barbados
In Labor Force | Age 45-54
In Labor Force | Age 45-54 Comparison
Central American Indians
Immigrants from Barbados
80.0%
IN LABOR FORCE | AGE 45-54
0.0/ 100
METRIC RATING
308th/ 347
METRIC RANK
81.3%
IN LABOR FORCE | AGE 45-54
0.0/ 100
METRIC RATING
271st/ 347
METRIC RANK
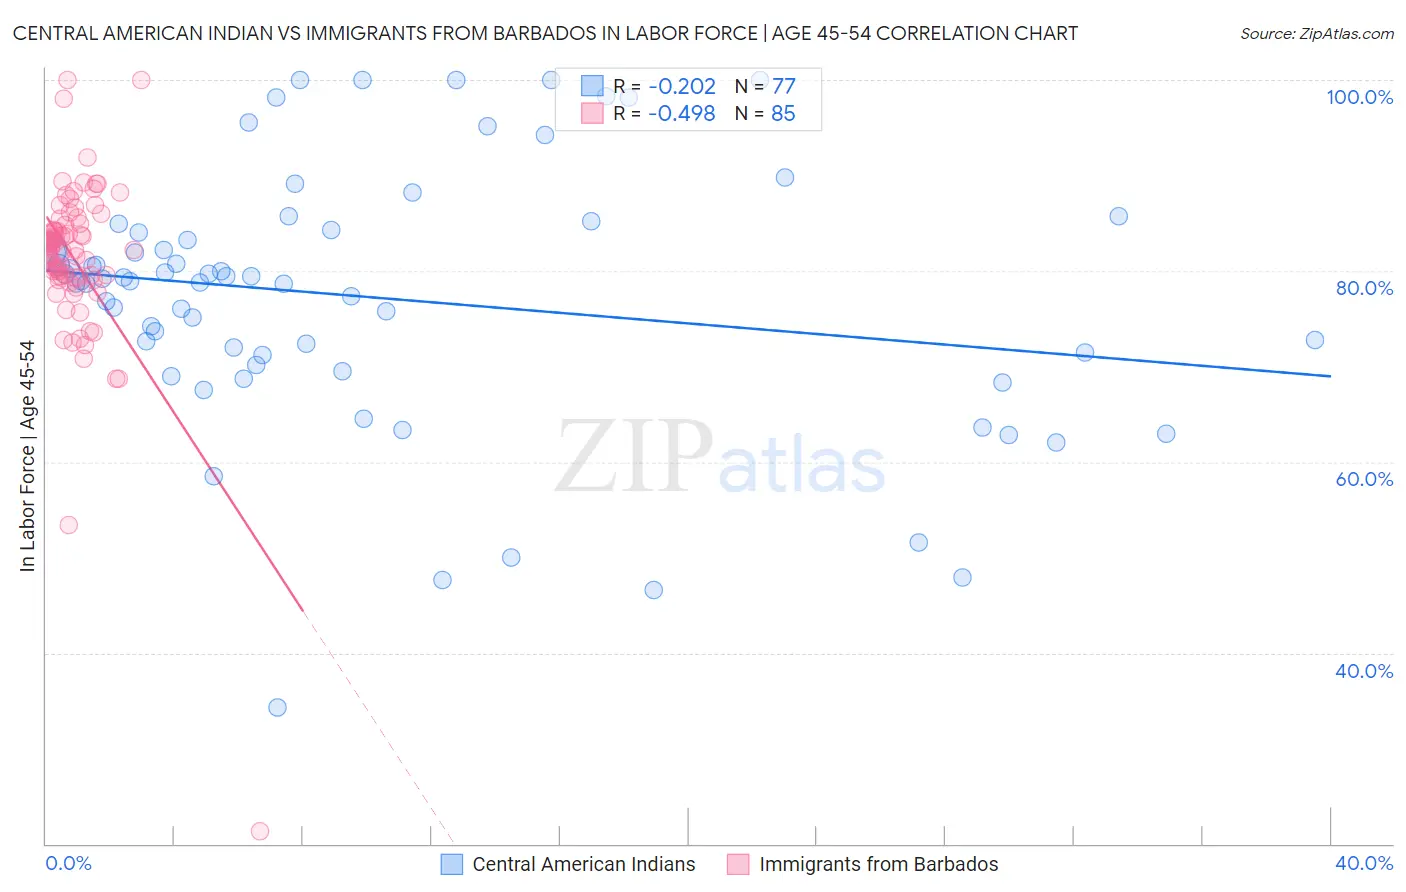
Central American Indian vs Immigrants from Barbados In Labor Force | Age 45-54 Correlation Chart
The statistical analysis conducted on geographies consisting of 326,071,382 people shows a weak negative correlation between the proportion of Central American Indians and labor force participation rate among population between the ages 45 and 54 in the United States with a correlation coefficient (R) of -0.202 and weighted average of 80.0%. Similarly, the statistical analysis conducted on geographies consisting of 112,763,171 people shows a moderate negative correlation between the proportion of Immigrants from Barbados and labor force participation rate among population between the ages 45 and 54 in the United States with a correlation coefficient (R) of -0.498 and weighted average of 81.3%, a difference of 1.7%.
In Labor Force | Age 45-54 Correlation Summary
| Measurement | Central American Indian | Immigrants from Barbados |
| Minimum | 34.3% | 21.3% |
| Maximum | 100.0% | 100.0% |
| Range | 65.7% | 78.7% |
| Mean | 77.2% | 81.2% |
| Median | 78.9% | 82.2% |
| Interquartile 25% (IQ1) | 70.6% | 79.3% |
| Interquartile 75% (IQ3) | 84.1% | 84.9% |
| Interquartile Range (IQR) | 13.5% | 5.6% |
| Standard Deviation (Sample) | 13.6% | 9.3% |
| Standard Deviation (Population) | 13.5% | 9.2% |
Similar Demographics by In Labor Force | Age 45-54
Demographics Similar to Central American Indians by In Labor Force | Age 45-54
In terms of in labor force | age 45-54, the demographic groups most similar to Central American Indians are Potawatomi (80.0%, a difference of 0.030%), Blackfeet (80.0%, a difference of 0.040%), Spanish American (80.1%, a difference of 0.12%), Inupiat (79.9%, a difference of 0.12%), and Hispanic or Latino (80.1%, a difference of 0.16%).
| Demographics | Rating | Rank | In Labor Force | Age 45-54 |
| Spanish American Indians | 0.0 /100 | #301 | Tragic 80.2% |
| Immigrants | Central America | 0.0 /100 | #302 | Tragic 80.2% |
| Immigrants | Azores | 0.0 /100 | #303 | Tragic 80.1% |
| Hispanics or Latinos | 0.0 /100 | #304 | Tragic 80.1% |
| Immigrants | Dominican Republic | 0.0 /100 | #305 | Tragic 80.1% |
| Spanish Americans | 0.0 /100 | #306 | Tragic 80.1% |
| Blackfeet | 0.0 /100 | #307 | Tragic 80.0% |
| Central American Indians | 0.0 /100 | #308 | Tragic 80.0% |
| Potawatomi | 0.0 /100 | #309 | Tragic 80.0% |
| Inupiat | 0.0 /100 | #310 | Tragic 79.9% |
| Mexicans | 0.0 /100 | #311 | Tragic 79.8% |
| Immigrants | Mexico | 0.0 /100 | #312 | Tragic 79.7% |
| Colville | 0.0 /100 | #313 | Tragic 79.5% |
| Ottawa | 0.0 /100 | #314 | Tragic 79.5% |
| Blacks/African Americans | 0.0 /100 | #315 | Tragic 79.3% |
Demographics Similar to Immigrants from Barbados by In Labor Force | Age 45-54
In terms of in labor force | age 45-54, the demographic groups most similar to Immigrants from Barbados are Bangladeshi (81.3%, a difference of 0.010%), Spanish (81.3%, a difference of 0.010%), Alsatian (81.3%, a difference of 0.040%), Immigrants from Honduras (81.4%, a difference of 0.060%), and Chippewa (81.3%, a difference of 0.070%).
| Demographics | Rating | Rank | In Labor Force | Age 45-54 |
| Immigrants | West Indies | 0.1 /100 | #264 | Tragic 81.5% |
| Hondurans | 0.1 /100 | #265 | Tragic 81.4% |
| Immigrants | St. Vincent and the Grenadines | 0.1 /100 | #266 | Tragic 81.4% |
| West Indians | 0.1 /100 | #267 | Tragic 81.4% |
| Immigrants | Honduras | 0.0 /100 | #268 | Tragic 81.4% |
| Alsatians | 0.0 /100 | #269 | Tragic 81.3% |
| Bangladeshis | 0.0 /100 | #270 | Tragic 81.3% |
| Immigrants | Barbados | 0.0 /100 | #271 | Tragic 81.3% |
| Spanish | 0.0 /100 | #272 | Tragic 81.3% |
| Chippewa | 0.0 /100 | #273 | Tragic 81.3% |
| British West Indians | 0.0 /100 | #274 | Tragic 81.2% |
| Immigrants | Nonimmigrants | 0.0 /100 | #275 | Tragic 81.2% |
| U.S. Virgin Islanders | 0.0 /100 | #276 | Tragic 81.2% |
| Guatemalans | 0.0 /100 | #277 | Tragic 81.2% |
| Immigrants | Guatemala | 0.0 /100 | #278 | Tragic 81.1% |