Cape Verdean vs West Indian In Labor Force | Age 20-24
COMPARE
Cape Verdean
West Indian
In Labor Force | Age 20-24
In Labor Force | Age 20-24 Comparison
Cape Verdeans
West Indians
78.3%
IN LABOR FORCE | AGE 20-24
100.0/ 100
METRIC RATING
17th/ 347
METRIC RANK
71.3%
IN LABOR FORCE | AGE 20-24
0.0/ 100
METRIC RATING
323rd/ 347
METRIC RANK
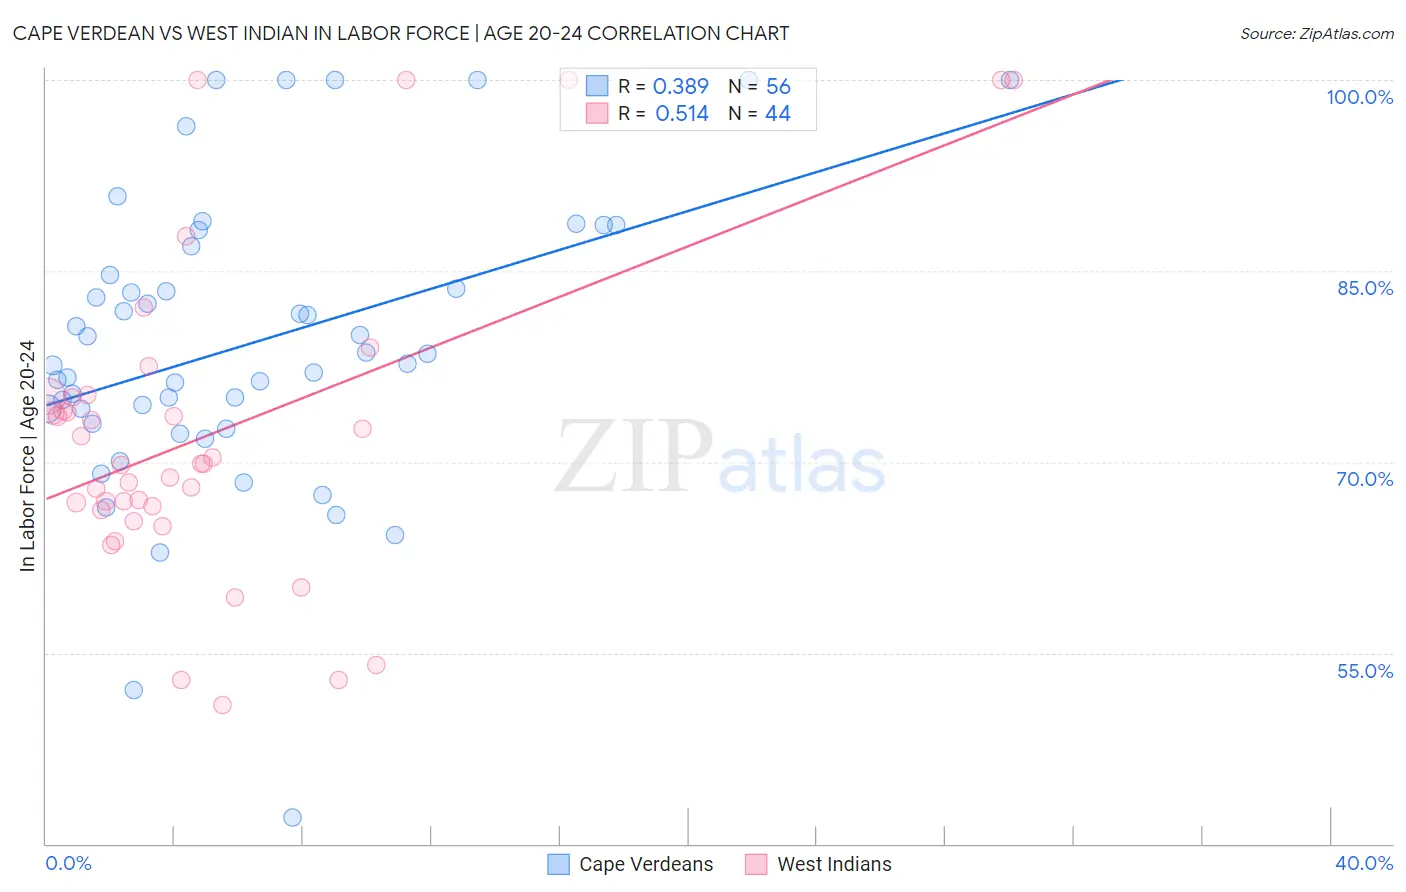
Cape Verdean vs West Indian In Labor Force | Age 20-24 Correlation Chart
The statistical analysis conducted on geographies consisting of 107,566,363 people shows a mild positive correlation between the proportion of Cape Verdeans and labor force participation rate among population between the ages 20 and 24 in the United States with a correlation coefficient (R) of 0.389 and weighted average of 78.3%. Similarly, the statistical analysis conducted on geographies consisting of 254,022,866 people shows a substantial positive correlation between the proportion of West Indians and labor force participation rate among population between the ages 20 and 24 in the United States with a correlation coefficient (R) of 0.514 and weighted average of 71.3%, a difference of 9.9%.
In Labor Force | Age 20-24 Correlation Summary
| Measurement | Cape Verdean | West Indian |
| Minimum | 42.1% | 50.9% |
| Maximum | 100.0% | 100.0% |
| Range | 57.9% | 49.1% |
| Mean | 79.3% | 72.3% |
| Median | 78.1% | 69.9% |
| Interquartile 25% (IQ1) | 73.6% | 66.3% |
| Interquartile 75% (IQ3) | 85.8% | 75.1% |
| Interquartile Range (IQR) | 12.2% | 8.7% |
| Standard Deviation (Sample) | 11.6% | 12.5% |
| Standard Deviation (Population) | 11.5% | 12.3% |
Similar Demographics by In Labor Force | Age 20-24
Demographics Similar to Cape Verdeans by In Labor Force | Age 20-24
In terms of in labor force | age 20-24, the demographic groups most similar to Cape Verdeans are Dutch (78.4%, a difference of 0.040%), Sudanese (78.4%, a difference of 0.090%), Czech (78.5%, a difference of 0.22%), Scandinavian (78.5%, a difference of 0.23%), and German (78.6%, a difference of 0.30%).
| Demographics | Rating | Rank | In Labor Force | Age 20-24 |
| Slovenes | 100.0 /100 | #10 | Exceptional 78.7% |
| Finns | 100.0 /100 | #11 | Exceptional 78.7% |
| Germans | 100.0 /100 | #12 | Exceptional 78.6% |
| Scandinavians | 100.0 /100 | #13 | Exceptional 78.5% |
| Czechs | 100.0 /100 | #14 | Exceptional 78.5% |
| Sudanese | 100.0 /100 | #15 | Exceptional 78.4% |
| Dutch | 100.0 /100 | #16 | Exceptional 78.4% |
| Cape Verdeans | 100.0 /100 | #17 | Exceptional 78.3% |
| Immigrants | Bosnia and Herzegovina | 100.0 /100 | #18 | Exceptional 78.1% |
| Bangladeshis | 100.0 /100 | #19 | Exceptional 78.1% |
| French Canadians | 100.0 /100 | #20 | Exceptional 78.1% |
| Puget Sound Salish | 100.0 /100 | #21 | Exceptional 78.0% |
| Pennsylvania Germans | 100.0 /100 | #22 | Exceptional 78.0% |
| Yugoslavians | 100.0 /100 | #23 | Exceptional 78.0% |
| Liberians | 100.0 /100 | #24 | Exceptional 78.0% |
Demographics Similar to West Indians by In Labor Force | Age 20-24
In terms of in labor force | age 20-24, the demographic groups most similar to West Indians are Immigrants from Dominican Republic (71.2%, a difference of 0.090%), Filipino (71.4%, a difference of 0.18%), Barbadian (71.1%, a difference of 0.20%), Dominican (71.1%, a difference of 0.28%), and Immigrants from Trinidad and Tobago (71.1%, a difference of 0.28%).
| Demographics | Rating | Rank | In Labor Force | Age 20-24 |
| Immigrants | Eastern Asia | 0.0 /100 | #316 | Tragic 71.8% |
| Immigrants | Armenia | 0.0 /100 | #317 | Tragic 71.7% |
| Immigrants | Hong Kong | 0.0 /100 | #318 | Tragic 71.6% |
| Immigrants | Israel | 0.0 /100 | #319 | Tragic 71.6% |
| Trinidadians and Tobagonians | 0.0 /100 | #320 | Tragic 71.5% |
| Immigrants | Taiwan | 0.0 /100 | #321 | Tragic 71.5% |
| Filipinos | 0.0 /100 | #322 | Tragic 71.4% |
| West Indians | 0.0 /100 | #323 | Tragic 71.3% |
| Immigrants | Dominican Republic | 0.0 /100 | #324 | Tragic 71.2% |
| Barbadians | 0.0 /100 | #325 | Tragic 71.1% |
| Dominicans | 0.0 /100 | #326 | Tragic 71.1% |
| Immigrants | Trinidad and Tobago | 0.0 /100 | #327 | Tragic 71.1% |
| Immigrants | China | 0.0 /100 | #328 | Tragic 71.1% |
| Yup'ik | 0.0 /100 | #329 | Tragic 70.9% |
| Vietnamese | 0.0 /100 | #330 | Tragic 70.6% |