Cape Verdean vs Central American Indian In Labor Force | Age 20-24
COMPARE
Cape Verdean
Central American Indian
In Labor Force | Age 20-24
In Labor Force | Age 20-24 Comparison
Cape Verdeans
Central American Indians
78.3%
IN LABOR FORCE | AGE 20-24
100.0/ 100
METRIC RATING
17th/ 347
METRIC RANK
72.7%
IN LABOR FORCE | AGE 20-24
0.0/ 100
METRIC RATING
297th/ 347
METRIC RANK
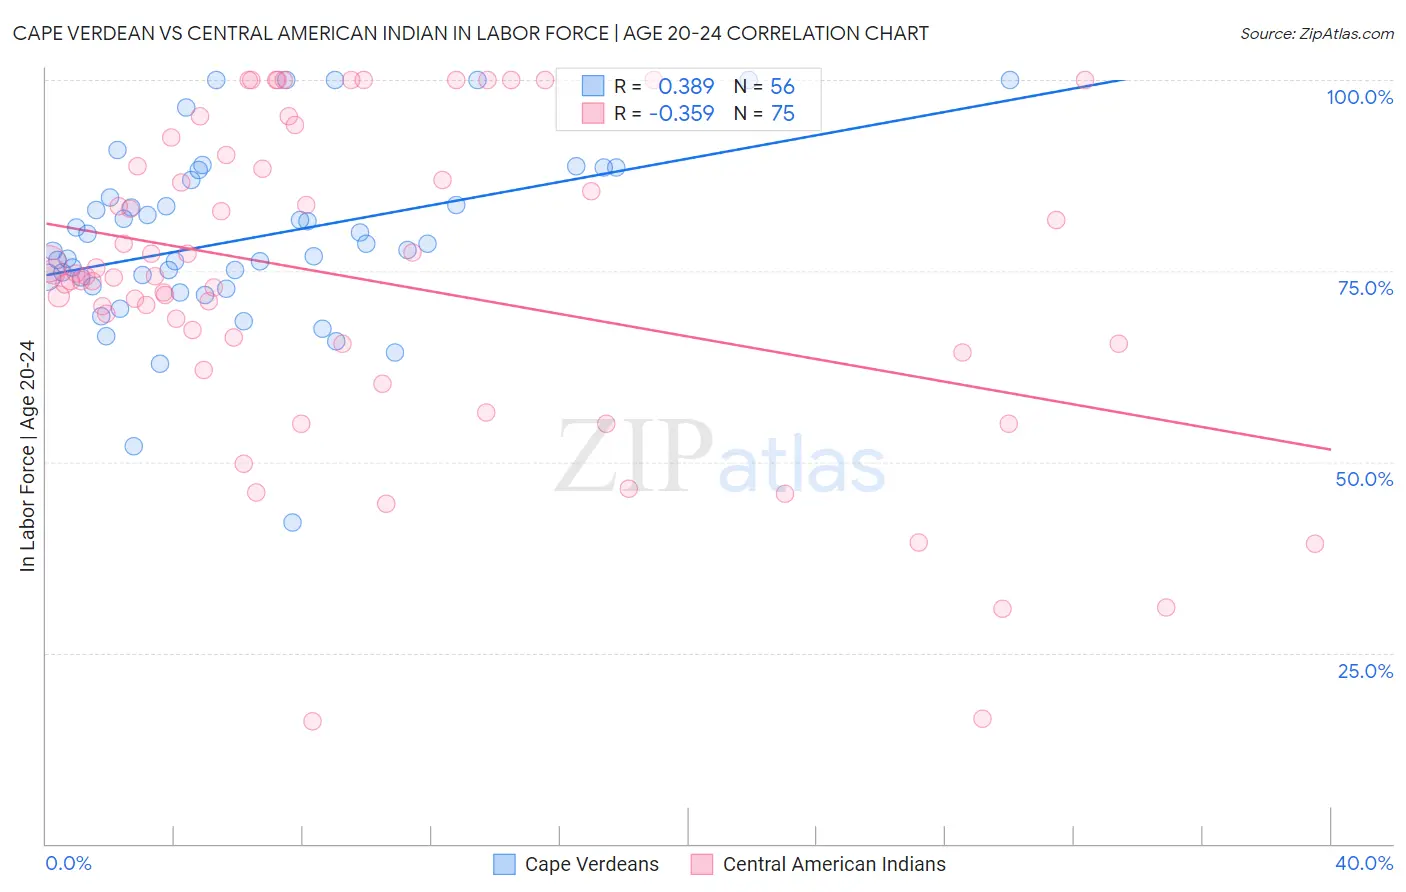
Cape Verdean vs Central American Indian In Labor Force | Age 20-24 Correlation Chart
The statistical analysis conducted on geographies consisting of 107,566,363 people shows a mild positive correlation between the proportion of Cape Verdeans and labor force participation rate among population between the ages 20 and 24 in the United States with a correlation coefficient (R) of 0.389 and weighted average of 78.3%. Similarly, the statistical analysis conducted on geographies consisting of 326,106,765 people shows a mild negative correlation between the proportion of Central American Indians and labor force participation rate among population between the ages 20 and 24 in the United States with a correlation coefficient (R) of -0.359 and weighted average of 72.7%, a difference of 7.8%.
In Labor Force | Age 20-24 Correlation Summary
| Measurement | Cape Verdean | Central American Indian |
| Minimum | 42.1% | 16.0% |
| Maximum | 100.0% | 100.0% |
| Range | 57.9% | 84.0% |
| Mean | 79.3% | 73.8% |
| Median | 78.1% | 74.3% |
| Interquartile 25% (IQ1) | 73.6% | 65.5% |
| Interquartile 75% (IQ3) | 85.8% | 88.7% |
| Interquartile Range (IQR) | 12.2% | 23.2% |
| Standard Deviation (Sample) | 11.6% | 20.4% |
| Standard Deviation (Population) | 11.5% | 20.3% |
Similar Demographics by In Labor Force | Age 20-24
Demographics Similar to Cape Verdeans by In Labor Force | Age 20-24
In terms of in labor force | age 20-24, the demographic groups most similar to Cape Verdeans are Dutch (78.4%, a difference of 0.040%), Sudanese (78.4%, a difference of 0.090%), Czech (78.5%, a difference of 0.22%), Scandinavian (78.5%, a difference of 0.23%), and German (78.6%, a difference of 0.30%).
| Demographics | Rating | Rank | In Labor Force | Age 20-24 |
| Slovenes | 100.0 /100 | #10 | Exceptional 78.7% |
| Finns | 100.0 /100 | #11 | Exceptional 78.7% |
| Germans | 100.0 /100 | #12 | Exceptional 78.6% |
| Scandinavians | 100.0 /100 | #13 | Exceptional 78.5% |
| Czechs | 100.0 /100 | #14 | Exceptional 78.5% |
| Sudanese | 100.0 /100 | #15 | Exceptional 78.4% |
| Dutch | 100.0 /100 | #16 | Exceptional 78.4% |
| Cape Verdeans | 100.0 /100 | #17 | Exceptional 78.3% |
| Immigrants | Bosnia and Herzegovina | 100.0 /100 | #18 | Exceptional 78.1% |
| Bangladeshis | 100.0 /100 | #19 | Exceptional 78.1% |
| French Canadians | 100.0 /100 | #20 | Exceptional 78.1% |
| Puget Sound Salish | 100.0 /100 | #21 | Exceptional 78.0% |
| Pennsylvania Germans | 100.0 /100 | #22 | Exceptional 78.0% |
| Yugoslavians | 100.0 /100 | #23 | Exceptional 78.0% |
| Liberians | 100.0 /100 | #24 | Exceptional 78.0% |
Demographics Similar to Central American Indians by In Labor Force | Age 20-24
In terms of in labor force | age 20-24, the demographic groups most similar to Central American Indians are Okinawan (72.7%, a difference of 0.050%), Jamaican (72.7%, a difference of 0.050%), Israeli (72.6%, a difference of 0.13%), Immigrants from Argentina (72.8%, a difference of 0.16%), and Iranian (72.6%, a difference of 0.17%).
| Demographics | Rating | Rank | In Labor Force | Age 20-24 |
| Immigrants | Belarus | 0.1 /100 | #290 | Tragic 73.0% |
| Immigrants | Nicaragua | 0.0 /100 | #291 | Tragic 72.9% |
| Pueblo | 0.0 /100 | #292 | Tragic 72.9% |
| Immigrants | Belize | 0.0 /100 | #293 | Tragic 72.8% |
| Immigrants | Argentina | 0.0 /100 | #294 | Tragic 72.8% |
| Okinawans | 0.0 /100 | #295 | Tragic 72.7% |
| Jamaicans | 0.0 /100 | #296 | Tragic 72.7% |
| Central American Indians | 0.0 /100 | #297 | Tragic 72.7% |
| Israelis | 0.0 /100 | #298 | Tragic 72.6% |
| Iranians | 0.0 /100 | #299 | Tragic 72.6% |
| Armenians | 0.0 /100 | #300 | Tragic 72.5% |
| Cubans | 0.0 /100 | #301 | Tragic 72.5% |
| Natives/Alaskans | 0.0 /100 | #302 | Tragic 72.4% |
| Ecuadorians | 0.0 /100 | #303 | Tragic 72.4% |
| Immigrants | West Indies | 0.0 /100 | #304 | Tragic 72.4% |