Immigrants from Netherlands vs Immigrants from Moldova In Labor Force | Age 20-24
COMPARE
Immigrants from Netherlands
Immigrants from Moldova
In Labor Force | Age 20-24
In Labor Force | Age 20-24 Comparison
Immigrants from Netherlands
Immigrants from Moldova
75.9%
IN LABOR FORCE | AGE 20-24
95.3/ 100
METRIC RATING
113th/ 347
METRIC RANK
76.6%
IN LABOR FORCE | AGE 20-24
99.6/ 100
METRIC RATING
76th/ 347
METRIC RANK
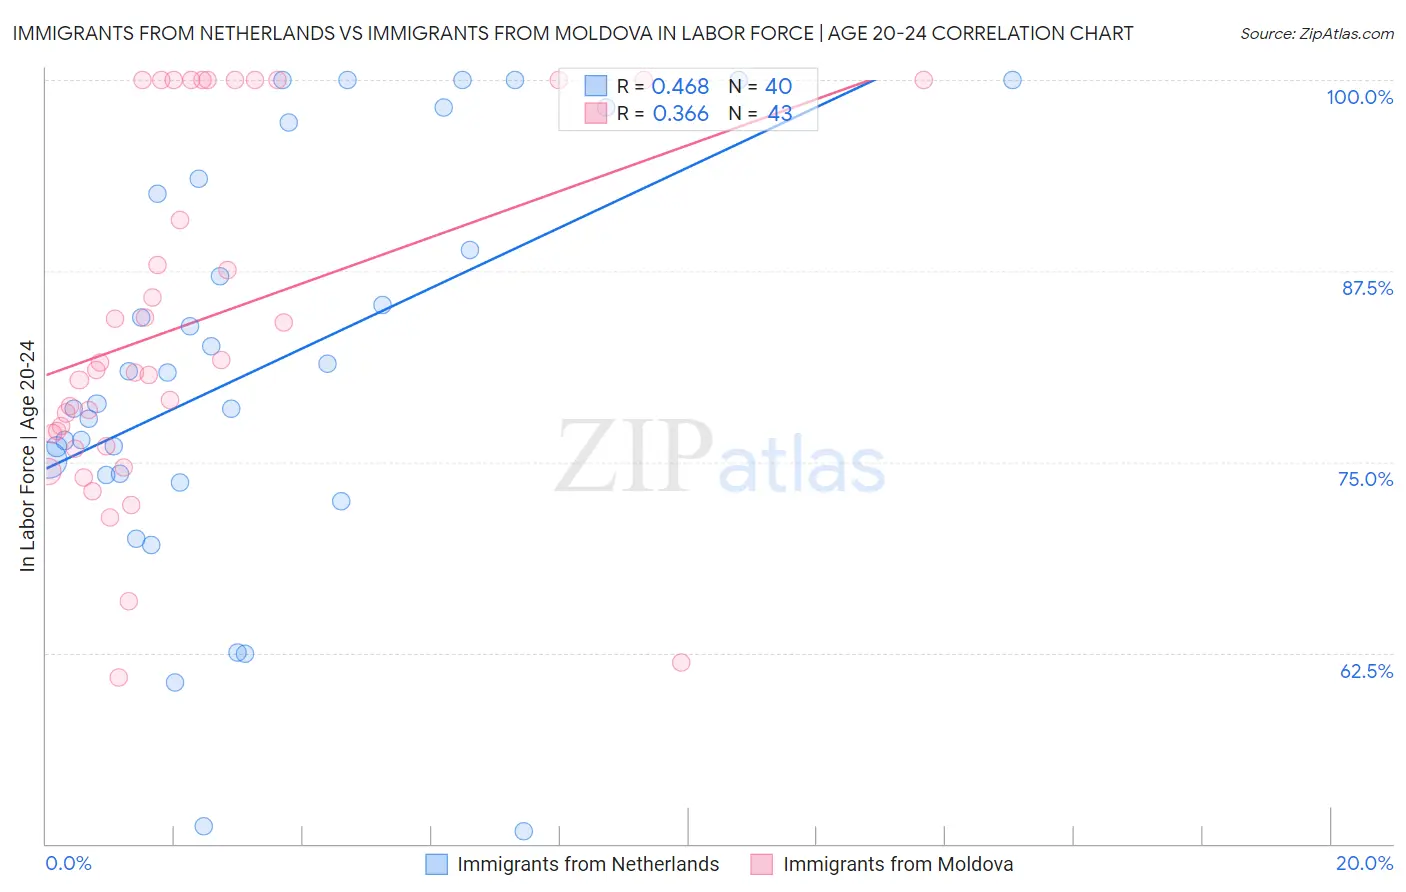
Immigrants from Netherlands vs Immigrants from Moldova In Labor Force | Age 20-24 Correlation Chart
The statistical analysis conducted on geographies consisting of 237,756,787 people shows a moderate positive correlation between the proportion of Immigrants from Netherlands and labor force participation rate among population between the ages 20 and 24 in the United States with a correlation coefficient (R) of 0.468 and weighted average of 75.9%. Similarly, the statistical analysis conducted on geographies consisting of 124,381,237 people shows a mild positive correlation between the proportion of Immigrants from Moldova and labor force participation rate among population between the ages 20 and 24 in the United States with a correlation coefficient (R) of 0.366 and weighted average of 76.6%, a difference of 0.96%.
In Labor Force | Age 20-24 Correlation Summary
| Measurement | Immigrants from Netherlands | Immigrants from Moldova |
| Minimum | 50.8% | 60.9% |
| Maximum | 100.0% | 100.0% |
| Range | 49.2% | 39.1% |
| Mean | 81.3% | 84.1% |
| Median | 79.8% | 81.0% |
| Interquartile 25% (IQ1) | 74.2% | 76.0% |
| Interquartile 75% (IQ3) | 93.0% | 100.0% |
| Interquartile Range (IQR) | 18.9% | 24.0% |
| Standard Deviation (Sample) | 13.4% | 11.6% |
| Standard Deviation (Population) | 13.2% | 11.5% |
Similar Demographics by In Labor Force | Age 20-24
Demographics Similar to Immigrants from Netherlands by In Labor Force | Age 20-24
In terms of in labor force | age 20-24, the demographic groups most similar to Immigrants from Netherlands are Immigrants from Zimbabwe (75.9%, a difference of 0.010%), Alaska Native (75.9%, a difference of 0.010%), Immigrants from North America (75.9%, a difference of 0.020%), Immigrants from Canada (75.9%, a difference of 0.030%), and Assyrian/Chaldean/Syriac (75.9%, a difference of 0.030%).
| Demographics | Rating | Rank | In Labor Force | Age 20-24 |
| Immigrants | Uganda | 97.1 /100 | #106 | Exceptional 76.0% |
| Greeks | 96.9 /100 | #107 | Exceptional 76.0% |
| Iraqis | 96.6 /100 | #108 | Exceptional 76.0% |
| Cherokee | 95.8 /100 | #109 | Exceptional 75.9% |
| Immigrants | Morocco | 95.8 /100 | #110 | Exceptional 75.9% |
| Ukrainians | 95.7 /100 | #111 | Exceptional 75.9% |
| Immigrants | Canada | 95.6 /100 | #112 | Exceptional 75.9% |
| Immigrants | Netherlands | 95.3 /100 | #113 | Exceptional 75.9% |
| Immigrants | Zimbabwe | 95.1 /100 | #114 | Exceptional 75.9% |
| Alaska Natives | 95.1 /100 | #115 | Exceptional 75.9% |
| Immigrants | North America | 95.0 /100 | #116 | Exceptional 75.9% |
| Assyrians/Chaldeans/Syriacs | 94.9 /100 | #117 | Exceptional 75.9% |
| Spanish Americans | 94.8 /100 | #118 | Exceptional 75.8% |
| Immigrants | Portugal | 94.8 /100 | #119 | Exceptional 75.8% |
| Immigrants | Africa | 94.6 /100 | #120 | Exceptional 75.8% |
Demographics Similar to Immigrants from Moldova by In Labor Force | Age 20-24
In terms of in labor force | age 20-24, the demographic groups most similar to Immigrants from Moldova are Immigrants from Cameroon (76.6%, a difference of 0.030%), Immigrants from Middle Africa (76.6%, a difference of 0.040%), Canadian (76.6%, a difference of 0.040%), Cree (76.6%, a difference of 0.060%), and Immigrants from Zaire (76.6%, a difference of 0.060%).
| Demographics | Rating | Rank | In Labor Force | Age 20-24 |
| Immigrants | Sudan | 99.8 /100 | #69 | Exceptional 76.8% |
| Ottawa | 99.8 /100 | #70 | Exceptional 76.8% |
| Northern Europeans | 99.8 /100 | #71 | Exceptional 76.8% |
| Guamanians/Chamorros | 99.8 /100 | #72 | Exceptional 76.7% |
| British | 99.8 /100 | #73 | Exceptional 76.7% |
| Cree | 99.7 /100 | #74 | Exceptional 76.6% |
| Immigrants | Middle Africa | 99.7 /100 | #75 | Exceptional 76.6% |
| Immigrants | Moldova | 99.6 /100 | #76 | Exceptional 76.6% |
| Immigrants | Cameroon | 99.6 /100 | #77 | Exceptional 76.6% |
| Canadians | 99.6 /100 | #78 | Exceptional 76.6% |
| Immigrants | Zaire | 99.6 /100 | #79 | Exceptional 76.6% |
| Italians | 99.6 /100 | #80 | Exceptional 76.5% |
| Basques | 99.5 /100 | #81 | Exceptional 76.5% |
| Hmong | 99.5 /100 | #82 | Exceptional 76.5% |
| Carpatho Rusyns | 99.4 /100 | #83 | Exceptional 76.5% |