Immigrants from Costa Rica vs Immigrants from Moldova In Labor Force | Age 20-24
COMPARE
Immigrants from Costa Rica
Immigrants from Moldova
In Labor Force | Age 20-24
In Labor Force | Age 20-24 Comparison
Immigrants from Costa Rica
Immigrants from Moldova
74.9%
IN LABOR FORCE | AGE 20-24
36.7/ 100
METRIC RATING
183rd/ 347
METRIC RANK
76.6%
IN LABOR FORCE | AGE 20-24
99.6/ 100
METRIC RATING
76th/ 347
METRIC RANK
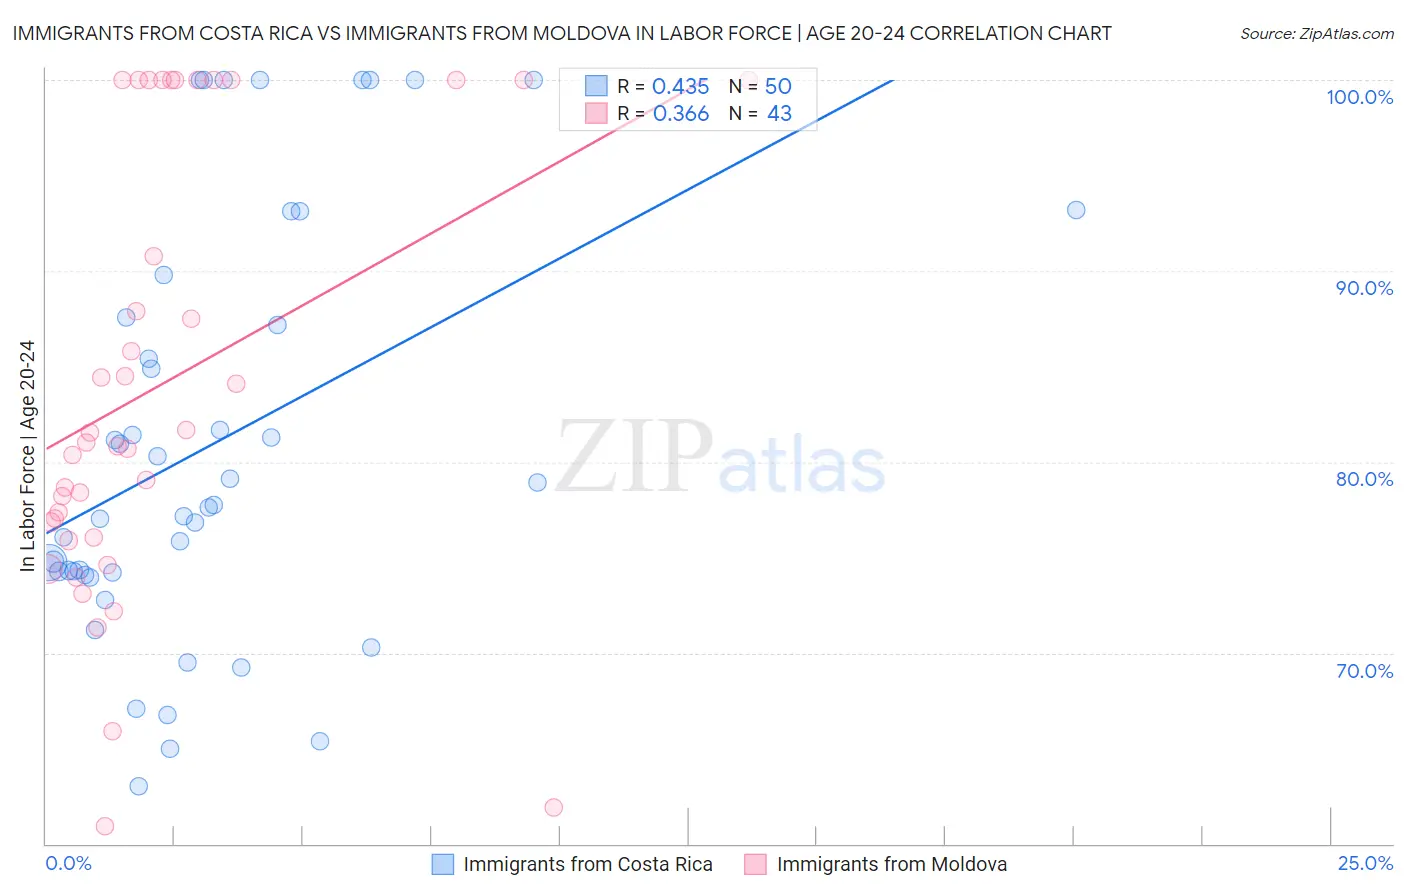
Immigrants from Costa Rica vs Immigrants from Moldova In Labor Force | Age 20-24 Correlation Chart
The statistical analysis conducted on geographies consisting of 204,265,207 people shows a moderate positive correlation between the proportion of Immigrants from Costa Rica and labor force participation rate among population between the ages 20 and 24 in the United States with a correlation coefficient (R) of 0.435 and weighted average of 74.9%. Similarly, the statistical analysis conducted on geographies consisting of 124,381,237 people shows a mild positive correlation between the proportion of Immigrants from Moldova and labor force participation rate among population between the ages 20 and 24 in the United States with a correlation coefficient (R) of 0.366 and weighted average of 76.6%, a difference of 2.3%.
In Labor Force | Age 20-24 Correlation Summary
| Measurement | Immigrants from Costa Rica | Immigrants from Moldova |
| Minimum | 63.0% | 60.9% |
| Maximum | 100.0% | 100.0% |
| Range | 37.0% | 39.1% |
| Mean | 80.9% | 84.1% |
| Median | 77.7% | 81.0% |
| Interquartile 25% (IQ1) | 74.2% | 76.0% |
| Interquartile 75% (IQ3) | 87.6% | 100.0% |
| Interquartile Range (IQR) | 13.4% | 24.0% |
| Standard Deviation (Sample) | 10.9% | 11.6% |
| Standard Deviation (Population) | 10.8% | 11.5% |
Similar Demographics by In Labor Force | Age 20-24
Demographics Similar to Immigrants from Costa Rica by In Labor Force | Age 20-24
In terms of in labor force | age 20-24, the demographic groups most similar to Immigrants from Costa Rica are Immigrants from South Africa (74.9%, a difference of 0.0%), Immigrants from Hungary (74.9%, a difference of 0.030%), Sri Lankan (74.9%, a difference of 0.030%), Immigrants from Eastern Europe (74.9%, a difference of 0.050%), and Immigrants from Honduras (74.9%, a difference of 0.050%).
| Demographics | Rating | Rank | In Labor Force | Age 20-24 |
| Central Americans | 48.7 /100 | #176 | Average 75.0% |
| Immigrants | Mexico | 47.8 /100 | #177 | Average 75.0% |
| Immigrants | Central America | 45.0 /100 | #178 | Average 75.0% |
| Immigrants | Latvia | 44.1 /100 | #179 | Average 75.0% |
| Immigrants | Czechoslovakia | 44.0 /100 | #180 | Average 75.0% |
| Africans | 42.5 /100 | #181 | Average 75.0% |
| Immigrants | South Africa | 36.9 /100 | #182 | Fair 74.9% |
| Immigrants | Costa Rica | 36.7 /100 | #183 | Fair 74.9% |
| Immigrants | Hungary | 35.0 /100 | #184 | Fair 74.9% |
| Sri Lankans | 34.9 /100 | #185 | Fair 74.9% |
| Immigrants | Eastern Europe | 33.8 /100 | #186 | Fair 74.9% |
| Immigrants | Honduras | 33.5 /100 | #187 | Fair 74.9% |
| Hondurans | 32.7 /100 | #188 | Fair 74.8% |
| Immigrants | Northern Europe | 32.6 /100 | #189 | Fair 74.8% |
| Russians | 32.2 /100 | #190 | Fair 74.8% |
Demographics Similar to Immigrants from Moldova by In Labor Force | Age 20-24
In terms of in labor force | age 20-24, the demographic groups most similar to Immigrants from Moldova are Immigrants from Cameroon (76.6%, a difference of 0.030%), Immigrants from Middle Africa (76.6%, a difference of 0.040%), Canadian (76.6%, a difference of 0.040%), Cree (76.6%, a difference of 0.060%), and Immigrants from Zaire (76.6%, a difference of 0.060%).
| Demographics | Rating | Rank | In Labor Force | Age 20-24 |
| Immigrants | Sudan | 99.8 /100 | #69 | Exceptional 76.8% |
| Ottawa | 99.8 /100 | #70 | Exceptional 76.8% |
| Northern Europeans | 99.8 /100 | #71 | Exceptional 76.8% |
| Guamanians/Chamorros | 99.8 /100 | #72 | Exceptional 76.7% |
| British | 99.8 /100 | #73 | Exceptional 76.7% |
| Cree | 99.7 /100 | #74 | Exceptional 76.6% |
| Immigrants | Middle Africa | 99.7 /100 | #75 | Exceptional 76.6% |
| Immigrants | Moldova | 99.6 /100 | #76 | Exceptional 76.6% |
| Immigrants | Cameroon | 99.6 /100 | #77 | Exceptional 76.6% |
| Canadians | 99.6 /100 | #78 | Exceptional 76.6% |
| Immigrants | Zaire | 99.6 /100 | #79 | Exceptional 76.6% |
| Italians | 99.6 /100 | #80 | Exceptional 76.5% |
| Basques | 99.5 /100 | #81 | Exceptional 76.5% |
| Hmong | 99.5 /100 | #82 | Exceptional 76.5% |
| Carpatho Rusyns | 99.4 /100 | #83 | Exceptional 76.5% |