Cape Verdean vs Immigrants from Eastern Europe In Labor Force | Age 20-24
COMPARE
Cape Verdean
Immigrants from Eastern Europe
In Labor Force | Age 20-24
In Labor Force | Age 20-24 Comparison
Cape Verdeans
Immigrants from Eastern Europe
78.3%
IN LABOR FORCE | AGE 20-24
100.0/ 100
METRIC RATING
17th/ 347
METRIC RANK
74.9%
IN LABOR FORCE | AGE 20-24
33.8/ 100
METRIC RATING
186th/ 347
METRIC RANK
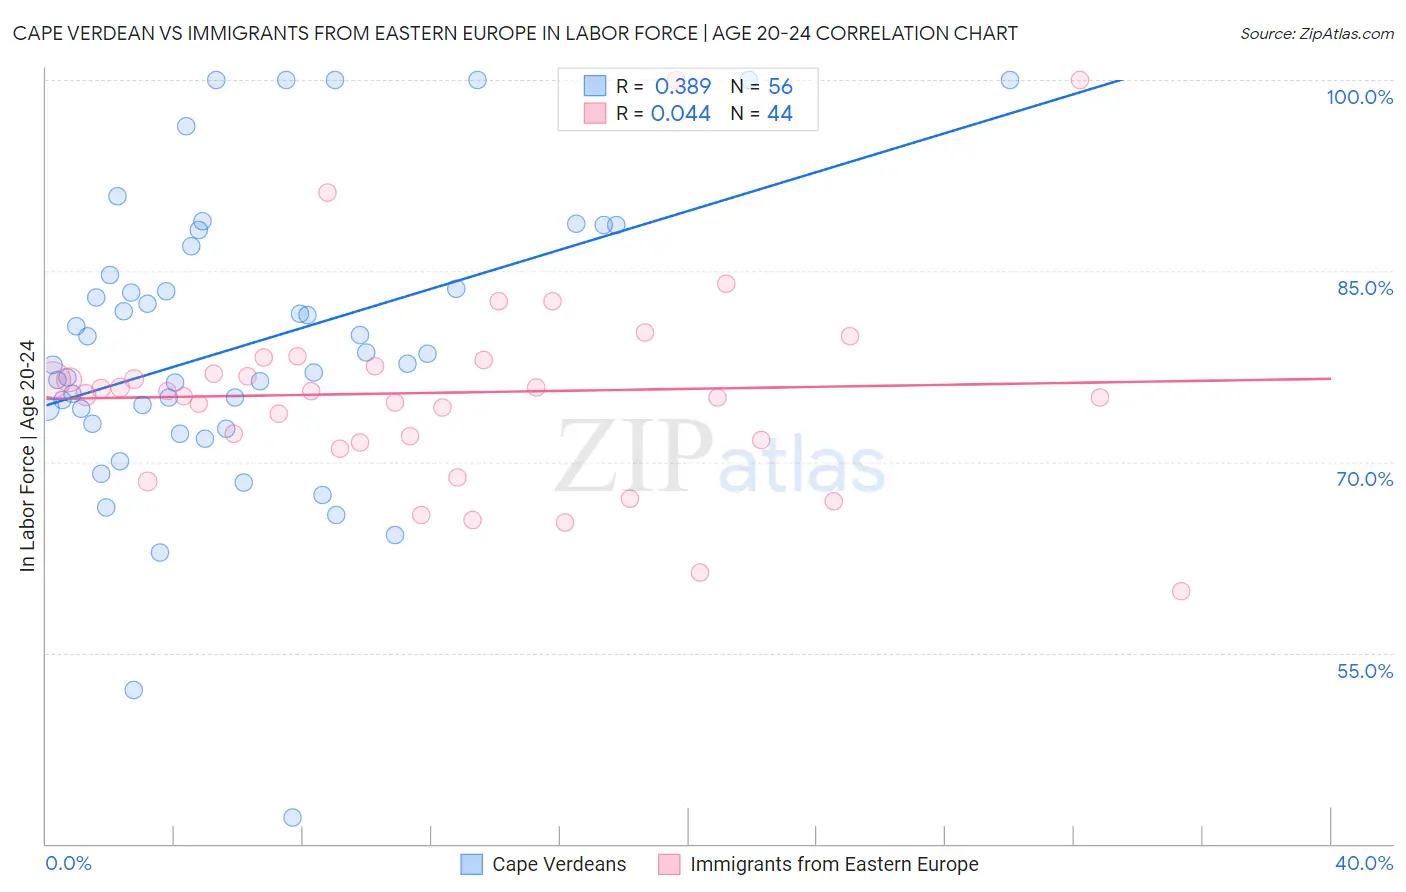
Cape Verdean vs Immigrants from Eastern Europe In Labor Force | Age 20-24 Correlation Chart
The statistical analysis conducted on geographies consisting of 107,566,363 people shows a mild positive correlation between the proportion of Cape Verdeans and labor force participation rate among population between the ages 20 and 24 in the United States with a correlation coefficient (R) of 0.389 and weighted average of 78.3%. Similarly, the statistical analysis conducted on geographies consisting of 475,471,166 people shows no correlation between the proportion of Immigrants from Eastern Europe and labor force participation rate among population between the ages 20 and 24 in the United States with a correlation coefficient (R) of 0.044 and weighted average of 74.9%, a difference of 4.7%.
In Labor Force | Age 20-24 Correlation Summary
| Measurement | Cape Verdean | Immigrants from Eastern Europe |
| Minimum | 42.1% | 59.8% |
| Maximum | 100.0% | 100.0% |
| Range | 57.9% | 40.2% |
| Mean | 79.3% | 75.4% |
| Median | 78.1% | 75.4% |
| Interquartile 25% (IQ1) | 73.6% | 71.6% |
| Interquartile 75% (IQ3) | 85.8% | 77.8% |
| Interquartile Range (IQR) | 12.2% | 6.1% |
| Standard Deviation (Sample) | 11.6% | 8.0% |
| Standard Deviation (Population) | 11.5% | 7.9% |
Similar Demographics by In Labor Force | Age 20-24
Demographics Similar to Cape Verdeans by In Labor Force | Age 20-24
In terms of in labor force | age 20-24, the demographic groups most similar to Cape Verdeans are Dutch (78.4%, a difference of 0.040%), Sudanese (78.4%, a difference of 0.090%), Czech (78.5%, a difference of 0.22%), Scandinavian (78.5%, a difference of 0.23%), and German (78.6%, a difference of 0.30%).
| Demographics | Rating | Rank | In Labor Force | Age 20-24 |
| Slovenes | 100.0 /100 | #10 | Exceptional 78.7% |
| Finns | 100.0 /100 | #11 | Exceptional 78.7% |
| Germans | 100.0 /100 | #12 | Exceptional 78.6% |
| Scandinavians | 100.0 /100 | #13 | Exceptional 78.5% |
| Czechs | 100.0 /100 | #14 | Exceptional 78.5% |
| Sudanese | 100.0 /100 | #15 | Exceptional 78.4% |
| Dutch | 100.0 /100 | #16 | Exceptional 78.4% |
| Cape Verdeans | 100.0 /100 | #17 | Exceptional 78.3% |
| Immigrants | Bosnia and Herzegovina | 100.0 /100 | #18 | Exceptional 78.1% |
| Bangladeshis | 100.0 /100 | #19 | Exceptional 78.1% |
| French Canadians | 100.0 /100 | #20 | Exceptional 78.1% |
| Puget Sound Salish | 100.0 /100 | #21 | Exceptional 78.0% |
| Pennsylvania Germans | 100.0 /100 | #22 | Exceptional 78.0% |
| Yugoslavians | 100.0 /100 | #23 | Exceptional 78.0% |
| Liberians | 100.0 /100 | #24 | Exceptional 78.0% |
Demographics Similar to Immigrants from Eastern Europe by In Labor Force | Age 20-24
In terms of in labor force | age 20-24, the demographic groups most similar to Immigrants from Eastern Europe are Immigrants from Honduras (74.9%, a difference of 0.010%), Immigrants from Hungary (74.9%, a difference of 0.020%), Sri Lankan (74.9%, a difference of 0.020%), Honduran (74.8%, a difference of 0.020%), and Immigrants from Northern Europe (74.8%, a difference of 0.020%).
| Demographics | Rating | Rank | In Labor Force | Age 20-24 |
| Immigrants | Latvia | 44.1 /100 | #179 | Average 75.0% |
| Immigrants | Czechoslovakia | 44.0 /100 | #180 | Average 75.0% |
| Africans | 42.5 /100 | #181 | Average 75.0% |
| Immigrants | South Africa | 36.9 /100 | #182 | Fair 74.9% |
| Immigrants | Costa Rica | 36.7 /100 | #183 | Fair 74.9% |
| Immigrants | Hungary | 35.0 /100 | #184 | Fair 74.9% |
| Sri Lankans | 34.9 /100 | #185 | Fair 74.9% |
| Immigrants | Eastern Europe | 33.8 /100 | #186 | Fair 74.9% |
| Immigrants | Honduras | 33.5 /100 | #187 | Fair 74.9% |
| Hondurans | 32.7 /100 | #188 | Fair 74.8% |
| Immigrants | Northern Europe | 32.6 /100 | #189 | Fair 74.8% |
| Russians | 32.2 /100 | #190 | Fair 74.8% |
| Senegalese | 28.1 /100 | #191 | Fair 74.8% |
| Immigrants | Europe | 27.5 /100 | #192 | Fair 74.8% |
| Alsatians | 27.1 /100 | #193 | Fair 74.8% |