Spaniard vs Immigrants from Moldova In Labor Force | Age 20-24
COMPARE
Spaniard
Immigrants from Moldova
In Labor Force | Age 20-24
In Labor Force | Age 20-24 Comparison
Spaniards
Immigrants from Moldova
75.5%
IN LABOR FORCE | AGE 20-24
82.0/ 100
METRIC RATING
143rd/ 347
METRIC RANK
76.6%
IN LABOR FORCE | AGE 20-24
99.6/ 100
METRIC RATING
76th/ 347
METRIC RANK
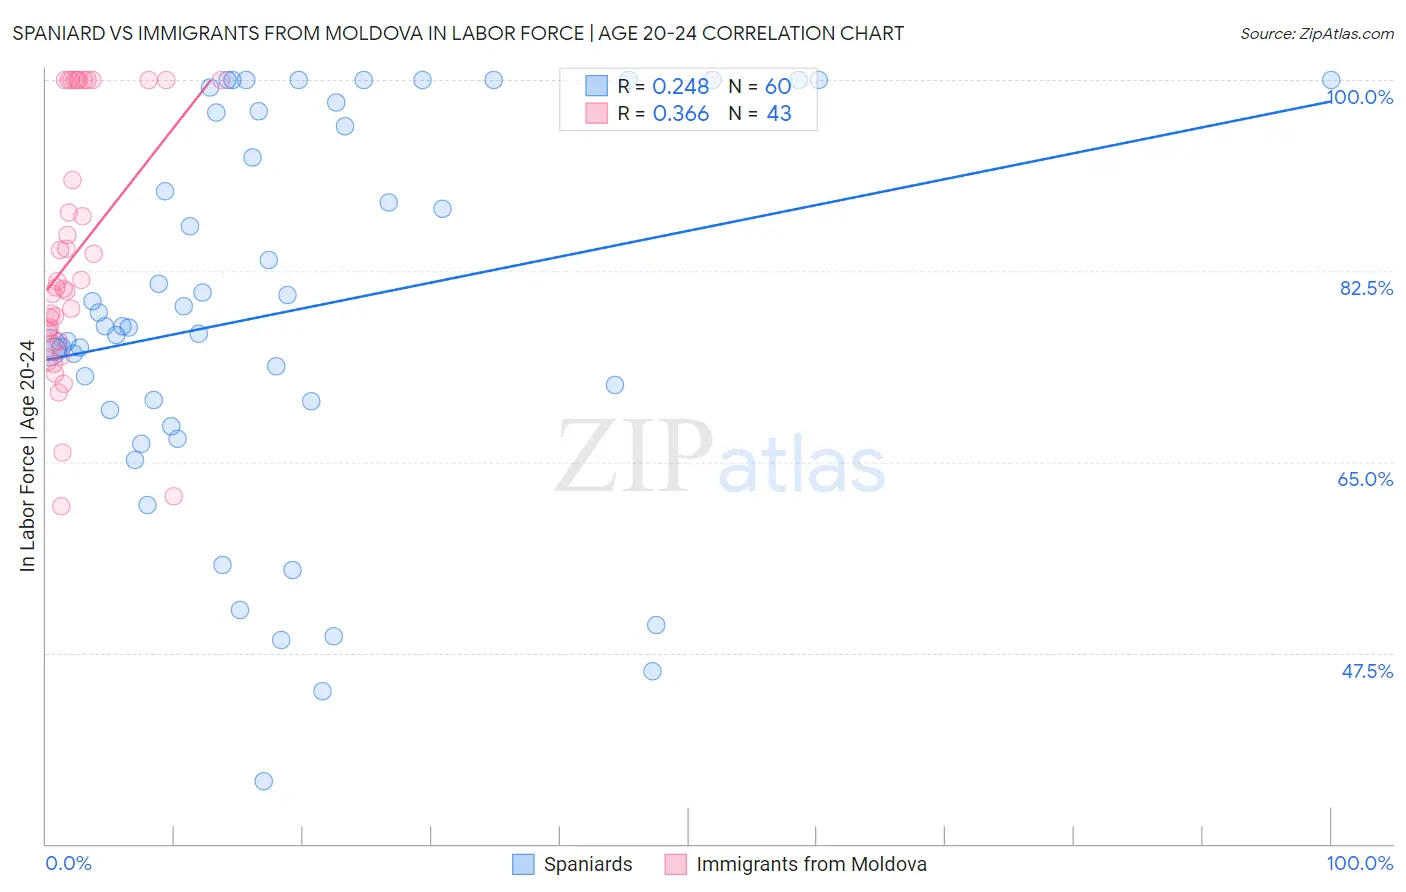
Spaniard vs Immigrants from Moldova In Labor Force | Age 20-24 Correlation Chart
The statistical analysis conducted on geographies consisting of 443,259,827 people shows a weak positive correlation between the proportion of Spaniards and labor force participation rate among population between the ages 20 and 24 in the United States with a correlation coefficient (R) of 0.248 and weighted average of 75.5%. Similarly, the statistical analysis conducted on geographies consisting of 124,381,237 people shows a mild positive correlation between the proportion of Immigrants from Moldova and labor force participation rate among population between the ages 20 and 24 in the United States with a correlation coefficient (R) of 0.366 and weighted average of 76.6%, a difference of 1.5%.
In Labor Force | Age 20-24 Correlation Summary
| Measurement | Spaniard | Immigrants from Moldova |
| Minimum | 35.7% | 60.9% |
| Maximum | 100.0% | 100.0% |
| Range | 64.3% | 39.1% |
| Mean | 78.8% | 84.1% |
| Median | 77.4% | 81.0% |
| Interquartile 25% (IQ1) | 70.2% | 76.0% |
| Interquartile 75% (IQ3) | 97.1% | 100.0% |
| Interquartile Range (IQR) | 26.9% | 24.0% |
| Standard Deviation (Sample) | 17.3% | 11.6% |
| Standard Deviation (Population) | 17.2% | 11.5% |
Similar Demographics by In Labor Force | Age 20-24
Demographics Similar to Spaniards by In Labor Force | Age 20-24
In terms of in labor force | age 20-24, the demographic groups most similar to Spaniards are Bhutanese (75.4%, a difference of 0.030%), Blackfeet (75.5%, a difference of 0.040%), Romanian (75.5%, a difference of 0.050%), Korean (75.4%, a difference of 0.050%), and Immigrants from Brazil (75.5%, a difference of 0.070%).
| Demographics | Rating | Rank | In Labor Force | Age 20-24 |
| Immigrants | Brazil | 84.8 /100 | #136 | Excellent 75.5% |
| Jordanians | 84.8 /100 | #137 | Excellent 75.5% |
| Australians | 84.8 /100 | #138 | Excellent 75.5% |
| Immigrants | England | 84.6 /100 | #139 | Excellent 75.5% |
| Delaware | 84.5 /100 | #140 | Excellent 75.5% |
| Romanians | 84.1 /100 | #141 | Excellent 75.5% |
| Blackfeet | 83.6 /100 | #142 | Excellent 75.5% |
| Spaniards | 82.0 /100 | #143 | Excellent 75.5% |
| Bhutanese | 80.8 /100 | #144 | Excellent 75.4% |
| Koreans | 79.7 /100 | #145 | Good 75.4% |
| Mexican American Indians | 78.8 /100 | #146 | Good 75.4% |
| Comanche | 77.6 /100 | #147 | Good 75.4% |
| Immigrants | Cambodia | 76.7 /100 | #148 | Good 75.4% |
| Ugandans | 76.1 /100 | #149 | Good 75.4% |
| Salvadorans | 74.8 /100 | #150 | Good 75.3% |
Demographics Similar to Immigrants from Moldova by In Labor Force | Age 20-24
In terms of in labor force | age 20-24, the demographic groups most similar to Immigrants from Moldova are Immigrants from Cameroon (76.6%, a difference of 0.030%), Immigrants from Middle Africa (76.6%, a difference of 0.040%), Canadian (76.6%, a difference of 0.040%), Cree (76.6%, a difference of 0.060%), and Immigrants from Zaire (76.6%, a difference of 0.060%).
| Demographics | Rating | Rank | In Labor Force | Age 20-24 |
| Immigrants | Sudan | 99.8 /100 | #69 | Exceptional 76.8% |
| Ottawa | 99.8 /100 | #70 | Exceptional 76.8% |
| Northern Europeans | 99.8 /100 | #71 | Exceptional 76.8% |
| Guamanians/Chamorros | 99.8 /100 | #72 | Exceptional 76.7% |
| British | 99.8 /100 | #73 | Exceptional 76.7% |
| Cree | 99.7 /100 | #74 | Exceptional 76.6% |
| Immigrants | Middle Africa | 99.7 /100 | #75 | Exceptional 76.6% |
| Immigrants | Moldova | 99.6 /100 | #76 | Exceptional 76.6% |
| Immigrants | Cameroon | 99.6 /100 | #77 | Exceptional 76.6% |
| Canadians | 99.6 /100 | #78 | Exceptional 76.6% |
| Immigrants | Zaire | 99.6 /100 | #79 | Exceptional 76.6% |
| Italians | 99.6 /100 | #80 | Exceptional 76.5% |
| Basques | 99.5 /100 | #81 | Exceptional 76.5% |
| Hmong | 99.5 /100 | #82 | Exceptional 76.5% |
| Carpatho Rusyns | 99.4 /100 | #83 | Exceptional 76.5% |