Immigrants from Senegal vs Immigrants from Moldova In Labor Force | Age 20-24
COMPARE
Immigrants from Senegal
Immigrants from Moldova
In Labor Force | Age 20-24
In Labor Force | Age 20-24 Comparison
Immigrants from Senegal
Immigrants from Moldova
74.0%
IN LABOR FORCE | AGE 20-24
2.1/ 100
METRIC RATING
241st/ 347
METRIC RANK
76.6%
IN LABOR FORCE | AGE 20-24
99.6/ 100
METRIC RATING
76th/ 347
METRIC RANK
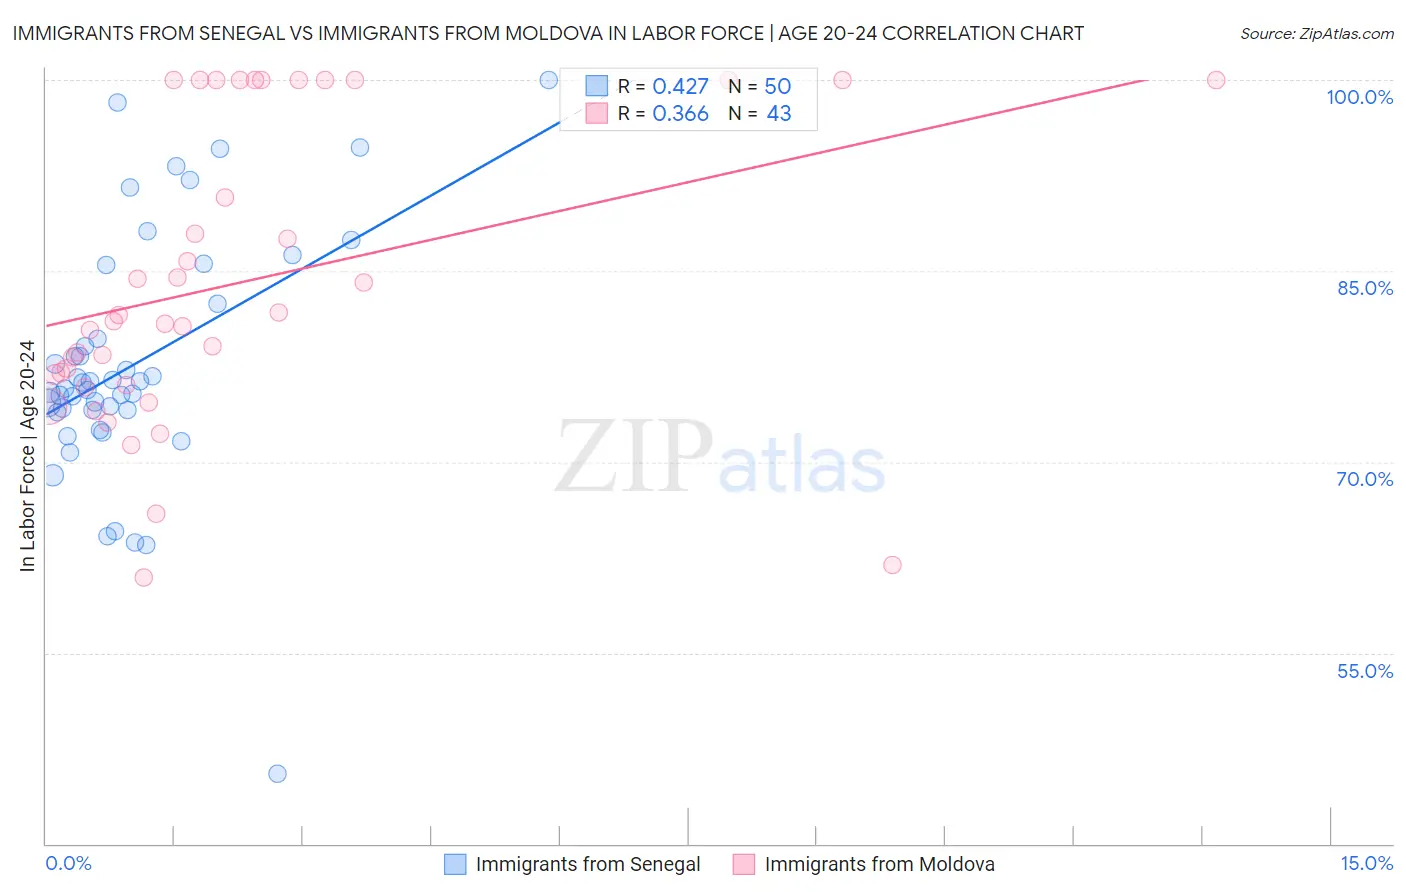
Immigrants from Senegal vs Immigrants from Moldova In Labor Force | Age 20-24 Correlation Chart
The statistical analysis conducted on geographies consisting of 90,118,430 people shows a moderate positive correlation between the proportion of Immigrants from Senegal and labor force participation rate among population between the ages 20 and 24 in the United States with a correlation coefficient (R) of 0.427 and weighted average of 74.0%. Similarly, the statistical analysis conducted on geographies consisting of 124,381,237 people shows a mild positive correlation between the proportion of Immigrants from Moldova and labor force participation rate among population between the ages 20 and 24 in the United States with a correlation coefficient (R) of 0.366 and weighted average of 76.6%, a difference of 3.5%.
In Labor Force | Age 20-24 Correlation Summary
| Measurement | Immigrants from Senegal | Immigrants from Moldova |
| Minimum | 45.5% | 60.9% |
| Maximum | 100.0% | 100.0% |
| Range | 54.5% | 39.1% |
| Mean | 77.7% | 84.1% |
| Median | 76.0% | 81.0% |
| Interquartile 25% (IQ1) | 74.1% | 76.0% |
| Interquartile 75% (IQ3) | 82.4% | 100.0% |
| Interquartile Range (IQR) | 8.3% | 24.0% |
| Standard Deviation (Sample) | 9.8% | 11.6% |
| Standard Deviation (Population) | 9.7% | 11.5% |
Similar Demographics by In Labor Force | Age 20-24
Demographics Similar to Immigrants from Senegal by In Labor Force | Age 20-24
In terms of in labor force | age 20-24, the demographic groups most similar to Immigrants from Senegal are Thai (74.0%, a difference of 0.010%), Immigrants from Sri Lanka (74.0%, a difference of 0.030%), Immigrants from Syria (74.0%, a difference of 0.040%), Immigrants from South Central Asia (74.0%, a difference of 0.040%), and Turkish (73.9%, a difference of 0.070%).
| Demographics | Rating | Rank | In Labor Force | Age 20-24 |
| Immigrants | Immigrants | 3.6 /100 | #234 | Tragic 74.1% |
| Laotians | 3.5 /100 | #235 | Tragic 74.1% |
| Immigrants | France | 3.3 /100 | #236 | Tragic 74.1% |
| Bermudans | 3.2 /100 | #237 | Tragic 74.1% |
| Immigrants | Japan | 3.0 /100 | #238 | Tragic 74.1% |
| Immigrants | Latin America | 2.7 /100 | #239 | Tragic 74.1% |
| Immigrants | Sri Lanka | 2.3 /100 | #240 | Tragic 74.0% |
| Immigrants | Senegal | 2.1 /100 | #241 | Tragic 74.0% |
| Thais | 2.1 /100 | #242 | Tragic 74.0% |
| Immigrants | Syria | 1.9 /100 | #243 | Tragic 74.0% |
| Immigrants | South Central Asia | 1.9 /100 | #244 | Tragic 74.0% |
| Turks | 1.8 /100 | #245 | Tragic 73.9% |
| Immigrants | Panama | 1.6 /100 | #246 | Tragic 73.9% |
| Colville | 1.5 /100 | #247 | Tragic 73.9% |
| Immigrants | Saudi Arabia | 1.5 /100 | #248 | Tragic 73.9% |
Demographics Similar to Immigrants from Moldova by In Labor Force | Age 20-24
In terms of in labor force | age 20-24, the demographic groups most similar to Immigrants from Moldova are Immigrants from Cameroon (76.6%, a difference of 0.030%), Immigrants from Middle Africa (76.6%, a difference of 0.040%), Canadian (76.6%, a difference of 0.040%), Cree (76.6%, a difference of 0.060%), and Immigrants from Zaire (76.6%, a difference of 0.060%).
| Demographics | Rating | Rank | In Labor Force | Age 20-24 |
| Immigrants | Sudan | 99.8 /100 | #69 | Exceptional 76.8% |
| Ottawa | 99.8 /100 | #70 | Exceptional 76.8% |
| Northern Europeans | 99.8 /100 | #71 | Exceptional 76.8% |
| Guamanians/Chamorros | 99.8 /100 | #72 | Exceptional 76.7% |
| British | 99.8 /100 | #73 | Exceptional 76.7% |
| Cree | 99.7 /100 | #74 | Exceptional 76.6% |
| Immigrants | Middle Africa | 99.7 /100 | #75 | Exceptional 76.6% |
| Immigrants | Moldova | 99.6 /100 | #76 | Exceptional 76.6% |
| Immigrants | Cameroon | 99.6 /100 | #77 | Exceptional 76.6% |
| Canadians | 99.6 /100 | #78 | Exceptional 76.6% |
| Immigrants | Zaire | 99.6 /100 | #79 | Exceptional 76.6% |
| Italians | 99.6 /100 | #80 | Exceptional 76.5% |
| Basques | 99.5 /100 | #81 | Exceptional 76.5% |
| Hmong | 99.5 /100 | #82 | Exceptional 76.5% |
| Carpatho Rusyns | 99.4 /100 | #83 | Exceptional 76.5% |