Canadian vs Pima Unemployment Among Ages 35 to 44 years
COMPARE
Canadian
Pima
Unemployment Among Ages 35 to 44 years
Unemployment Among Ages 35 to 44 years Comparison
Canadians
Pima
4.6%
UNEMPLOYMENT AMONG AGES 35 TO 44 YEARS
75.9/ 100
METRIC RATING
141st/ 347
METRIC RANK
11.8%
UNEMPLOYMENT AMONG AGES 35 TO 44 YEARS
0.0/ 100
METRIC RATING
344th/ 347
METRIC RANK
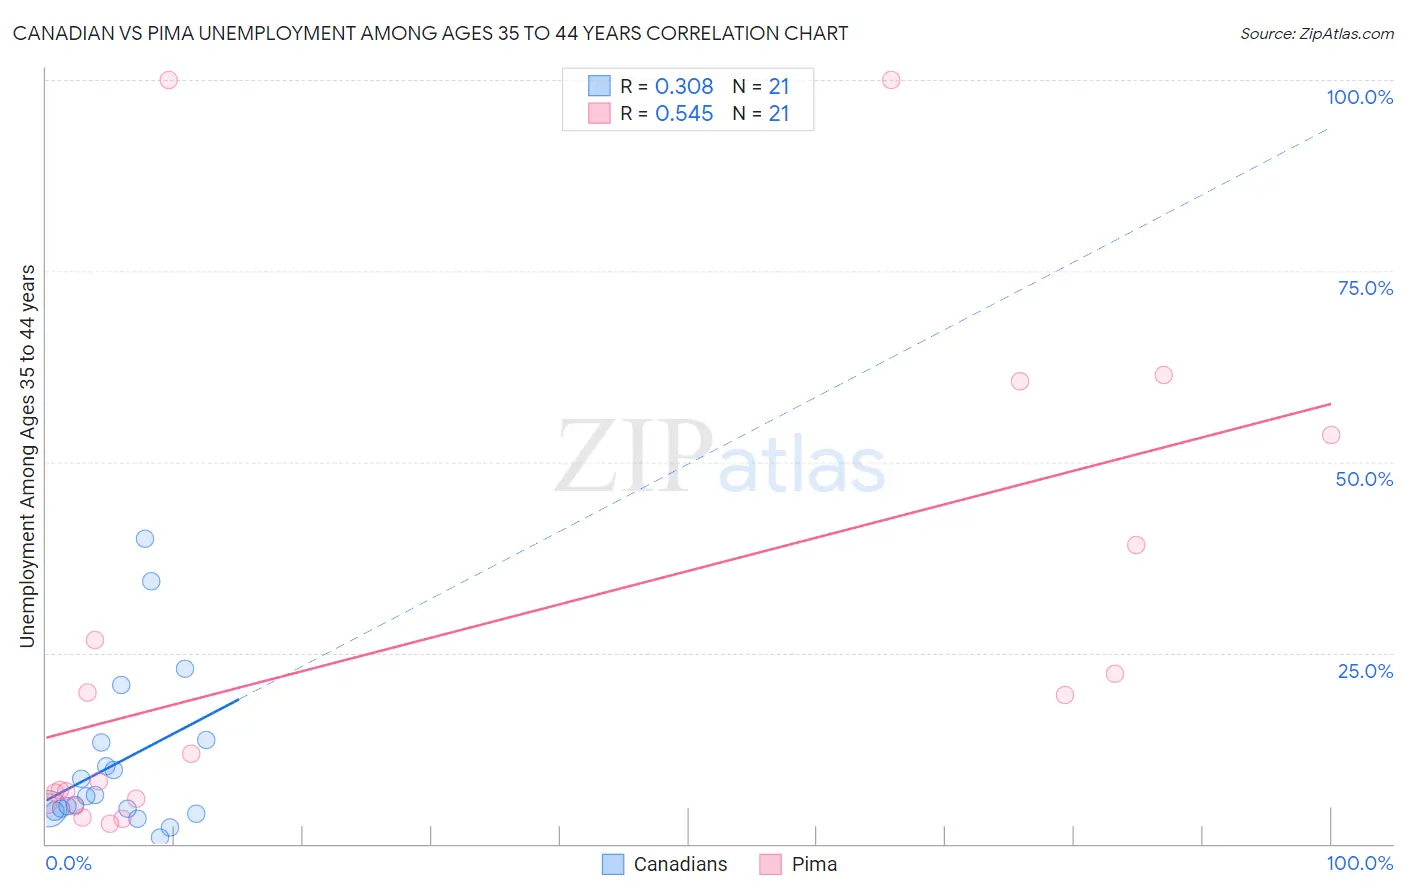
Canadian vs Pima Unemployment Among Ages 35 to 44 years Correlation Chart
The statistical analysis conducted on geographies consisting of 422,895,705 people shows a mild positive correlation between the proportion of Canadians and unemployment rate among population between the ages 35 and 44 in the United States with a correlation coefficient (R) of 0.308 and weighted average of 4.6%. Similarly, the statistical analysis conducted on geographies consisting of 61,252,012 people shows a substantial positive correlation between the proportion of Pima and unemployment rate among population between the ages 35 and 44 in the United States with a correlation coefficient (R) of 0.545 and weighted average of 11.8%, a difference of 156.0%.
Unemployment Among Ages 35 to 44 years Correlation Summary
| Measurement | Canadian | Pima |
| Minimum | 0.80% | 2.7% |
| Maximum | 40.0% | 100.0% |
| Range | 39.2% | 97.3% |
| Mean | 10.7% | 27.1% |
| Median | 6.1% | 11.8% |
| Interquartile 25% (IQ1) | 4.4% | 5.6% |
| Interquartile 75% (IQ3) | 13.5% | 46.3% |
| Interquartile Range (IQR) | 9.0% | 40.7% |
| Standard Deviation (Sample) | 10.5% | 30.7% |
| Standard Deviation (Population) | 10.3% | 30.0% |
Similar Demographics by Unemployment Among Ages 35 to 44 years
Demographics Similar to Canadians by Unemployment Among Ages 35 to 44 years
In terms of unemployment among ages 35 to 44 years, the demographic groups most similar to Canadians are Immigrants from Eastern Africa (4.6%, a difference of 0.010%), Ukrainian (4.6%, a difference of 0.010%), Immigrants from Hungary (4.6%, a difference of 0.030%), Immigrants from Switzerland (4.6%, a difference of 0.050%), and Immigrants from Russia (4.6%, a difference of 0.050%).
| Demographics | Rating | Rank | Unemployment Among Ages 35 to 44 years |
| Laotians | 80.1 /100 | #134 | Excellent 4.6% |
| Immigrants | Europe | 79.4 /100 | #135 | Good 4.6% |
| Scotch-Irish | 79.3 /100 | #136 | Good 4.6% |
| Immigrants | Iraq | 78.9 /100 | #137 | Good 4.6% |
| Immigrants | Norway | 77.5 /100 | #138 | Good 4.6% |
| Immigrants | Hungary | 76.3 /100 | #139 | Good 4.6% |
| Immigrants | Eastern Africa | 76.0 /100 | #140 | Good 4.6% |
| Canadians | 75.9 /100 | #141 | Good 4.6% |
| Ukrainians | 75.8 /100 | #142 | Good 4.6% |
| Immigrants | Switzerland | 75.5 /100 | #143 | Good 4.6% |
| Immigrants | Russia | 75.4 /100 | #144 | Good 4.6% |
| Immigrants | Eastern Europe | 74.7 /100 | #145 | Good 4.6% |
| Immigrants | Denmark | 74.4 /100 | #146 | Good 4.6% |
| Immigrants | Vietnam | 73.8 /100 | #147 | Good 4.6% |
| Slavs | 72.4 /100 | #148 | Good 4.6% |
Demographics Similar to Pima by Unemployment Among Ages 35 to 44 years
In terms of unemployment among ages 35 to 44 years, the demographic groups most similar to Pima are Arapaho (10.3%, a difference of 14.3%), Yup'ik (14.4%, a difference of 22.8%), Navajo (9.3%, a difference of 25.9%), Hopi (8.9%, a difference of 32.4%), and Crow (15.7%, a difference of 33.6%).
| Demographics | Rating | Rank | Unemployment Among Ages 35 to 44 years |
| Puerto Ricans | 0.0 /100 | #333 | Tragic 7.6% |
| Houma | 0.0 /100 | #334 | Tragic 7.8% |
| Sioux | 0.0 /100 | #335 | Tragic 8.4% |
| Apache | 0.0 /100 | #336 | Tragic 8.4% |
| Tohono O'odham | 0.0 /100 | #337 | Tragic 8.4% |
| Cheyenne | 0.0 /100 | #338 | Tragic 8.5% |
| Inupiat | 0.0 /100 | #339 | Tragic 8.6% |
| Alaskan Athabascans | 0.0 /100 | #340 | Tragic 8.6% |
| Hopi | 0.0 /100 | #341 | Tragic 8.9% |
| Navajo | 0.0 /100 | #342 | Tragic 9.3% |
| Arapaho | 0.0 /100 | #343 | Tragic 10.3% |
| Pima | 0.0 /100 | #344 | Tragic 11.8% |
| Yup'ik | 0.0 /100 | #345 | Tragic 14.4% |
| Crow | 0.0 /100 | #346 | Tragic 15.7% |
| Yuman | 0.0 /100 | #347 | Tragic 16.9% |