Canadian vs Pima In Labor Force | Age 25-29
COMPARE
Canadian
Pima
In Labor Force | Age 25-29
In Labor Force | Age 25-29 Comparison
Canadians
Pima
84.7%
IN LABOR FORCE | AGE 25-29
58.5/ 100
METRIC RATING
161st/ 347
METRIC RANK
74.3%
IN LABOR FORCE | AGE 25-29
0.0/ 100
METRIC RATING
346th/ 347
METRIC RANK
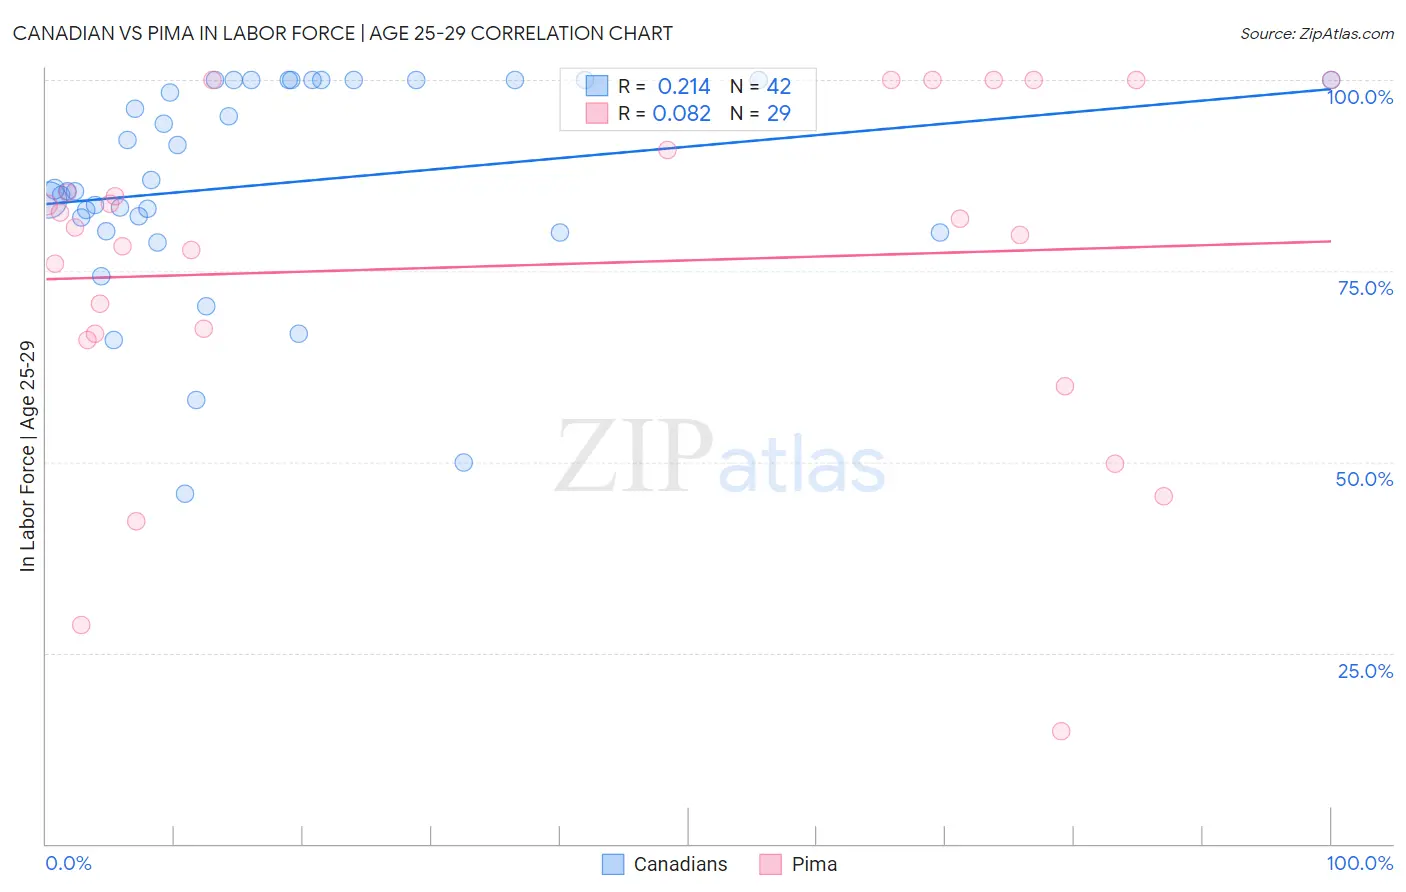
Canadian vs Pima In Labor Force | Age 25-29 Correlation Chart
The statistical analysis conducted on geographies consisting of 437,288,132 people shows a weak positive correlation between the proportion of Canadians and labor force participation rate among population between the ages 25 and 29 in the United States with a correlation coefficient (R) of 0.214 and weighted average of 84.7%. Similarly, the statistical analysis conducted on geographies consisting of 61,533,053 people shows a slight positive correlation between the proportion of Pima and labor force participation rate among population between the ages 25 and 29 in the United States with a correlation coefficient (R) of 0.082 and weighted average of 74.3%, a difference of 14.0%.
In Labor Force | Age 25-29 Correlation Summary
| Measurement | Canadian | Pima |
| Minimum | 45.8% | 14.8% |
| Maximum | 100.0% | 100.0% |
| Range | 54.2% | 85.2% |
| Mean | 86.4% | 75.8% |
| Median | 85.6% | 80.7% |
| Interquartile 25% (IQ1) | 80.2% | 66.3% |
| Interquartile 75% (IQ3) | 100.0% | 95.4% |
| Interquartile Range (IQR) | 19.8% | 29.1% |
| Standard Deviation (Sample) | 14.1% | 22.3% |
| Standard Deviation (Population) | 13.9% | 21.9% |
Similar Demographics by In Labor Force | Age 25-29
Demographics Similar to Canadians by In Labor Force | Age 25-29
In terms of in labor force | age 25-29, the demographic groups most similar to Canadians are Immigrants from Peru (84.7%, a difference of 0.0%), Immigrants from Colombia (84.7%, a difference of 0.0%), Argentinean (84.7%, a difference of 0.0%), British (84.7%, a difference of 0.010%), and Immigrants from Ghana (84.7%, a difference of 0.010%).
| Demographics | Rating | Rank | In Labor Force | Age 25-29 |
| Immigrants | Sri Lanka | 61.7 /100 | #154 | Good 84.7% |
| Indians (Asian) | 61.6 /100 | #155 | Good 84.7% |
| French | 61.0 /100 | #156 | Good 84.7% |
| British | 60.4 /100 | #157 | Good 84.7% |
| Immigrants | Ghana | 60.2 /100 | #158 | Good 84.7% |
| Immigrants | Western Africa | 60.1 /100 | #159 | Good 84.7% |
| Immigrants | Peru | 58.6 /100 | #160 | Average 84.7% |
| Canadians | 58.5 /100 | #161 | Average 84.7% |
| Immigrants | Colombia | 58.3 /100 | #162 | Average 84.7% |
| Argentineans | 57.9 /100 | #163 | Average 84.7% |
| Ghanaians | 57.6 /100 | #164 | Average 84.7% |
| Immigrants | Burma/Myanmar | 57.4 /100 | #165 | Average 84.7% |
| Immigrants | Spain | 56.9 /100 | #166 | Average 84.7% |
| Indonesians | 56.5 /100 | #167 | Average 84.7% |
| South Americans | 54.9 /100 | #168 | Average 84.7% |
Demographics Similar to Pima by In Labor Force | Age 25-29
In terms of in labor force | age 25-29, the demographic groups most similar to Pima are Navajo (74.6%, a difference of 0.48%), Yup'ik (73.1%, a difference of 1.7%), Hopi (76.5%, a difference of 3.0%), Arapaho (76.6%, a difference of 3.1%), and Pueblo (77.5%, a difference of 4.3%).
| Demographics | Rating | Rank | In Labor Force | Age 25-29 |
| Sioux | 0.0 /100 | #333 | Tragic 79.7% |
| Yuman | 0.0 /100 | #334 | Tragic 79.3% |
| Natives/Alaskans | 0.0 /100 | #335 | Tragic 79.3% |
| Apache | 0.0 /100 | #336 | Tragic 79.2% |
| Crow | 0.0 /100 | #337 | Tragic 78.6% |
| Lumbee | 0.0 /100 | #338 | Tragic 78.3% |
| Immigrants | Yemen | 0.0 /100 | #339 | Tragic 78.2% |
| Paiute | 0.0 /100 | #340 | Tragic 78.1% |
| Tohono O'odham | 0.0 /100 | #341 | Tragic 77.5% |
| Pueblo | 0.0 /100 | #342 | Tragic 77.5% |
| Arapaho | 0.0 /100 | #343 | Tragic 76.6% |
| Hopi | 0.0 /100 | #344 | Tragic 76.5% |
| Navajo | 0.0 /100 | #345 | Tragic 74.6% |
| Pima | 0.0 /100 | #346 | Tragic 74.3% |
| Yup'ik | 0.0 /100 | #347 | Tragic 73.1% |