Trinidadian and Tobagonian vs Pima In Labor Force | Age 35-44
COMPARE
Trinidadian and Tobagonian
Pima
In Labor Force | Age 35-44
In Labor Force | Age 35-44 Comparison
Trinidadians and Tobagonians
Pima
84.5%
IN LABOR FORCE | AGE 35-44
69.5/ 100
METRIC RATING
153rd/ 347
METRIC RANK
74.8%
IN LABOR FORCE | AGE 35-44
0.0/ 100
METRIC RATING
344th/ 347
METRIC RANK
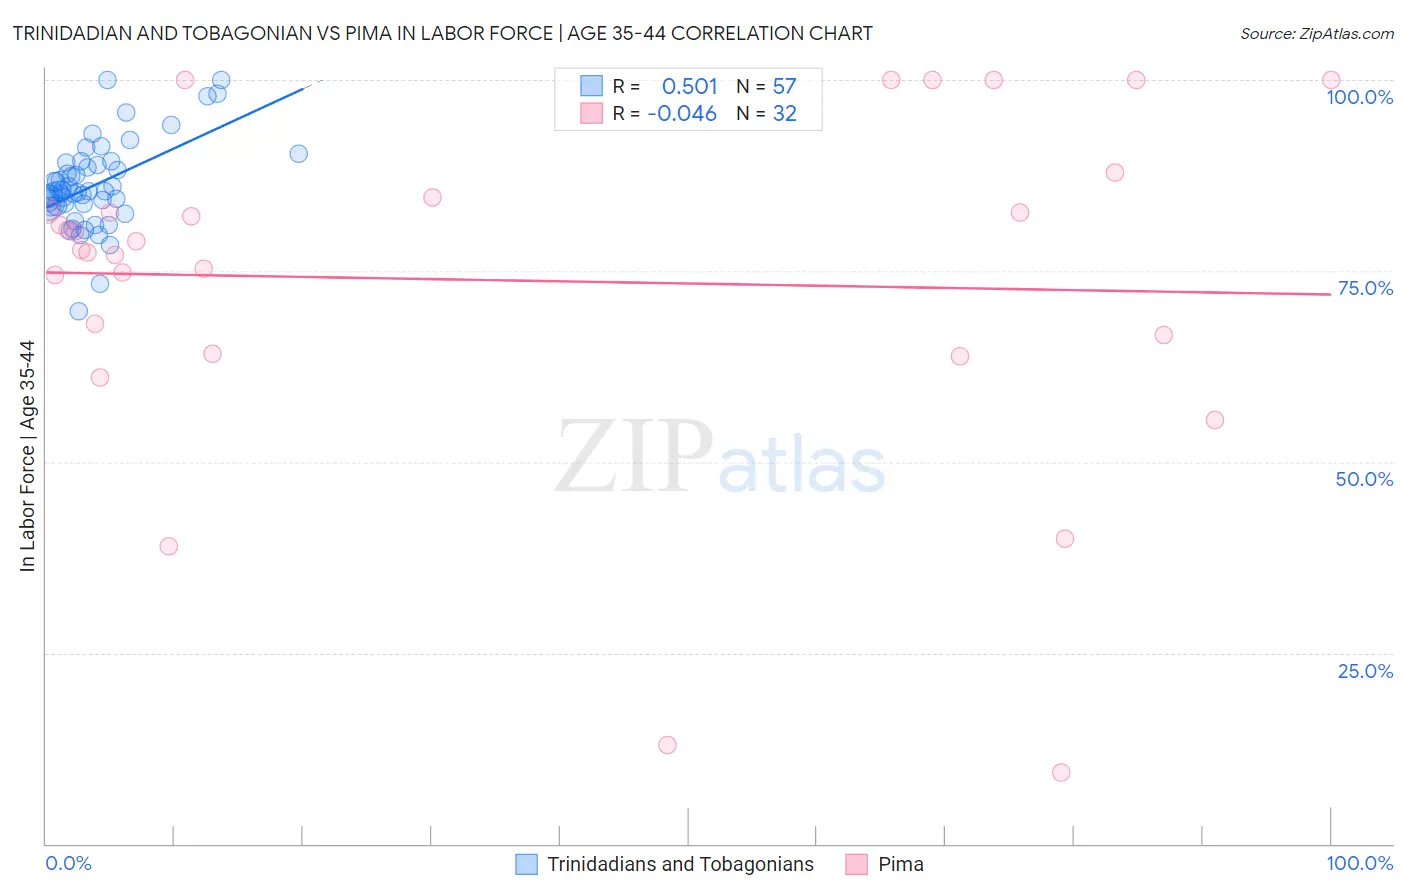
Trinidadian and Tobagonian vs Pima In Labor Force | Age 35-44 Correlation Chart
The statistical analysis conducted on geographies consisting of 219,757,398 people shows a substantial positive correlation between the proportion of Trinidadians and Tobagonians and labor force participation rate among population between the ages 35 and 44 in the United States with a correlation coefficient (R) of 0.501 and weighted average of 84.5%. Similarly, the statistical analysis conducted on geographies consisting of 61,535,254 people shows no correlation between the proportion of Pima and labor force participation rate among population between the ages 35 and 44 in the United States with a correlation coefficient (R) of -0.046 and weighted average of 74.8%, a difference of 12.9%.
In Labor Force | Age 35-44 Correlation Summary
| Measurement | Trinidadian and Tobagonian | Pima |
| Minimum | 69.7% | 9.3% |
| Maximum | 100.0% | 100.0% |
| Range | 30.3% | 90.7% |
| Mean | 86.2% | 73.8% |
| Median | 85.4% | 78.3% |
| Interquartile 25% (IQ1) | 83.6% | 65.4% |
| Interquartile 75% (IQ3) | 89.0% | 83.7% |
| Interquartile Range (IQR) | 5.4% | 18.4% |
| Standard Deviation (Sample) | 5.7% | 22.7% |
| Standard Deviation (Population) | 5.7% | 22.3% |
Similar Demographics by In Labor Force | Age 35-44
Demographics Similar to Trinidadians and Tobagonians by In Labor Force | Age 35-44
In terms of in labor force | age 35-44, the demographic groups most similar to Trinidadians and Tobagonians are Iranian (84.5%, a difference of 0.0%), Immigrants from Taiwan (84.5%, a difference of 0.010%), Romanian (84.5%, a difference of 0.020%), South American Indian (84.5%, a difference of 0.030%), and Okinawan (84.5%, a difference of 0.030%).
| Demographics | Rating | Rank | In Labor Force | Age 35-44 |
| Immigrants | Asia | 78.7 /100 | #146 | Good 84.5% |
| Immigrants | Netherlands | 76.6 /100 | #147 | Good 84.5% |
| South American Indians | 73.6 /100 | #148 | Good 84.5% |
| Okinawans | 73.5 /100 | #149 | Good 84.5% |
| Immigrants | Nigeria | 73.3 /100 | #150 | Good 84.5% |
| Romanians | 72.1 /100 | #151 | Good 84.5% |
| Immigrants | Taiwan | 71.4 /100 | #152 | Good 84.5% |
| Trinidadians and Tobagonians | 69.5 /100 | #153 | Good 84.5% |
| Iranians | 69.4 /100 | #154 | Good 84.5% |
| Immigrants | Switzerland | 65.9 /100 | #155 | Good 84.5% |
| Immigrants | Israel | 64.3 /100 | #156 | Good 84.4% |
| Immigrants | Austria | 63.8 /100 | #157 | Good 84.4% |
| Jamaicans | 62.7 /100 | #158 | Good 84.4% |
| Immigrants | Senegal | 60.4 /100 | #159 | Good 84.4% |
| Immigrants | Kazakhstan | 60.4 /100 | #160 | Good 84.4% |
Demographics Similar to Pima by In Labor Force | Age 35-44
In terms of in labor force | age 35-44, the demographic groups most similar to Pima are Yuman (74.7%, a difference of 0.13%), Tohono O'odham (74.1%, a difference of 0.96%), Navajo (73.8%, a difference of 1.3%), Immigrants from Yemen (76.3%, a difference of 1.9%), and Crow (76.5%, a difference of 2.2%).
| Demographics | Rating | Rank | In Labor Force | Age 35-44 |
| Kiowa | 0.0 /100 | #333 | Tragic 79.2% |
| Yakama | 0.0 /100 | #334 | Tragic 79.0% |
| Natives/Alaskans | 0.0 /100 | #335 | Tragic 78.9% |
| Arapaho | 0.0 /100 | #336 | Tragic 78.1% |
| Apache | 0.0 /100 | #337 | Tragic 77.9% |
| Pueblo | 0.0 /100 | #338 | Tragic 77.4% |
| Yup'ik | 0.0 /100 | #339 | Tragic 77.3% |
| Lumbee | 0.0 /100 | #340 | Tragic 77.0% |
| Hopi | 0.0 /100 | #341 | Tragic 77.0% |
| Crow | 0.0 /100 | #342 | Tragic 76.5% |
| Immigrants | Yemen | 0.0 /100 | #343 | Tragic 76.3% |
| Pima | 0.0 /100 | #344 | Tragic 74.8% |
| Yuman | 0.0 /100 | #345 | Tragic 74.7% |
| Tohono O'odham | 0.0 /100 | #346 | Tragic 74.1% |
| Navajo | 0.0 /100 | #347 | Tragic 73.8% |