Immigrants from India vs Basque In Labor Force | Age 20-64
COMPARE
Immigrants from India
Basque
In Labor Force | Age 20-64
In Labor Force | Age 20-64 Comparison
Immigrants from India
Basques
81.3%
IN LABOR FORCE | AGE 20-64
100.0/ 100
METRIC RATING
13th/ 347
METRIC RANK
78.7%
IN LABOR FORCE | AGE 20-64
0.5/ 100
METRIC RATING
253rd/ 347
METRIC RANK
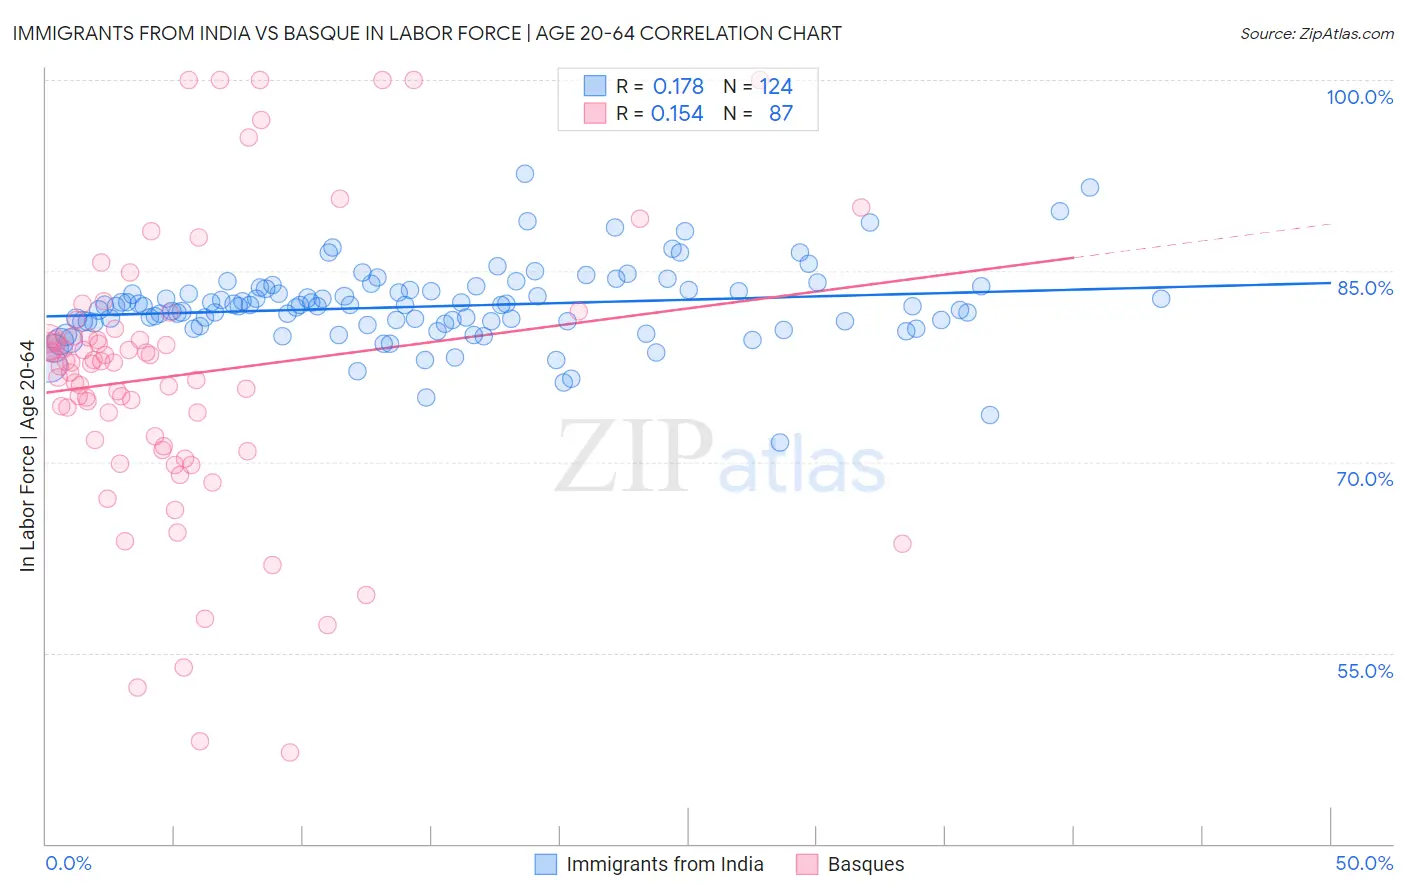
Immigrants from India vs Basque In Labor Force | Age 20-64 Correlation Chart
The statistical analysis conducted on geographies consisting of 434,133,401 people shows a poor positive correlation between the proportion of Immigrants from India and labor force participation rate among population between the ages 20 and 64 in the United States with a correlation coefficient (R) of 0.178 and weighted average of 81.3%. Similarly, the statistical analysis conducted on geographies consisting of 165,779,636 people shows a poor positive correlation between the proportion of Basques and labor force participation rate among population between the ages 20 and 64 in the United States with a correlation coefficient (R) of 0.154 and weighted average of 78.7%, a difference of 3.2%.
In Labor Force | Age 20-64 Correlation Summary
| Measurement | Immigrants from India | Basque |
| Minimum | 71.5% | 47.2% |
| Maximum | 92.6% | 100.0% |
| Range | 21.1% | 52.8% |
| Mean | 82.2% | 76.8% |
| Median | 82.3% | 77.8% |
| Interquartile 25% (IQ1) | 80.9% | 71.2% |
| Interquartile 75% (IQ3) | 83.5% | 79.8% |
| Interquartile Range (IQR) | 2.6% | 8.6% |
| Standard Deviation (Sample) | 3.1% | 11.0% |
| Standard Deviation (Population) | 3.1% | 11.0% |
Similar Demographics by In Labor Force | Age 20-64
Demographics Similar to Immigrants from India by In Labor Force | Age 20-64
In terms of in labor force | age 20-64, the demographic groups most similar to Immigrants from India are Immigrants from Eritrea (81.3%, a difference of 0.030%), Immigrants from Eastern Africa (81.3%, a difference of 0.060%), Cambodian (81.1%, a difference of 0.24%), Immigrants from Sierra Leone (81.5%, a difference of 0.25%), and Bulgarian (81.1%, a difference of 0.25%).
| Demographics | Rating | Rank | In Labor Force | Age 20-64 |
| Somalis | 100.0 /100 | #6 | Exceptional 81.6% |
| Immigrants | Cameroon | 100.0 /100 | #7 | Exceptional 81.6% |
| Immigrants | Somalia | 100.0 /100 | #8 | Exceptional 81.6% |
| Sierra Leoneans | 100.0 /100 | #9 | Exceptional 81.5% |
| Immigrants | Sierra Leone | 100.0 /100 | #10 | Exceptional 81.5% |
| Immigrants | Eastern Africa | 100.0 /100 | #11 | Exceptional 81.3% |
| Immigrants | Eritrea | 100.0 /100 | #12 | Exceptional 81.3% |
| Immigrants | India | 100.0 /100 | #13 | Exceptional 81.3% |
| Cambodians | 100.0 /100 | #14 | Exceptional 81.1% |
| Bulgarians | 100.0 /100 | #15 | Exceptional 81.1% |
| Immigrants | Nepal | 100.0 /100 | #16 | Exceptional 81.1% |
| Norwegians | 100.0 /100 | #17 | Exceptional 81.0% |
| Immigrants | Bulgaria | 100.0 /100 | #18 | Exceptional 81.0% |
| Zimbabweans | 100.0 /100 | #19 | Exceptional 81.0% |
| Thais | 100.0 /100 | #20 | Exceptional 80.9% |
Demographics Similar to Basques by In Labor Force | Age 20-64
In terms of in labor force | age 20-64, the demographic groups most similar to Basques are Immigrants from Lebanon (78.7%, a difference of 0.0%), Immigrants from Honduras (78.7%, a difference of 0.010%), Hawaiian (78.7%, a difference of 0.020%), Celtic (78.7%, a difference of 0.020%), and Guatemalan (78.7%, a difference of 0.040%).
| Demographics | Rating | Rank | In Labor Force | Age 20-64 |
| Immigrants | Trinidad and Tobago | 1.1 /100 | #246 | Tragic 78.8% |
| Immigrants | Germany | 1.0 /100 | #247 | Tragic 78.8% |
| Immigrants | Caribbean | 1.0 /100 | #248 | Tragic 78.8% |
| English | 0.9 /100 | #249 | Tragic 78.8% |
| Hondurans | 0.8 /100 | #250 | Tragic 78.8% |
| Barbadians | 0.7 /100 | #251 | Tragic 78.8% |
| Immigrants | Honduras | 0.6 /100 | #252 | Tragic 78.7% |
| Basques | 0.5 /100 | #253 | Tragic 78.7% |
| Immigrants | Lebanon | 0.5 /100 | #254 | Tragic 78.7% |
| Hawaiians | 0.5 /100 | #255 | Tragic 78.7% |
| Celtics | 0.5 /100 | #256 | Tragic 78.7% |
| Guatemalans | 0.4 /100 | #257 | Tragic 78.7% |
| Immigrants | Guatemala | 0.4 /100 | #258 | Tragic 78.7% |
| Tsimshian | 0.4 /100 | #259 | Tragic 78.7% |
| Immigrants | Fiji | 0.3 /100 | #260 | Tragic 78.6% |