Chilean vs Basque In Labor Force | Age 20-64
COMPARE
Chilean
Basque
In Labor Force | Age 20-64
In Labor Force | Age 20-64 Comparison
Chileans
Basques
80.1%
IN LABOR FORCE | AGE 20-64
97.0/ 100
METRIC RATING
88th/ 347
METRIC RANK
78.7%
IN LABOR FORCE | AGE 20-64
0.5/ 100
METRIC RATING
253rd/ 347
METRIC RANK
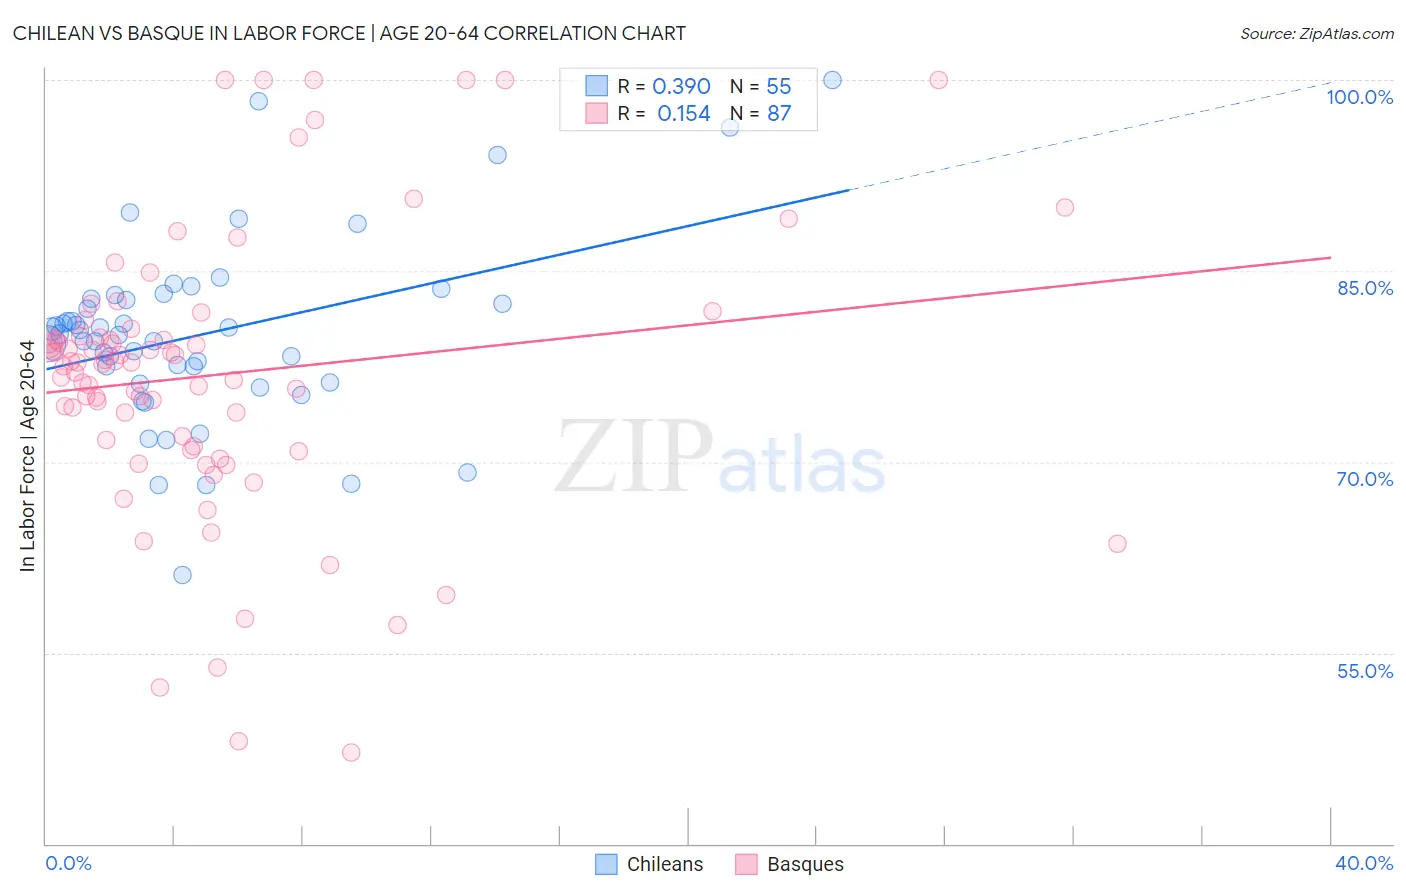
Chilean vs Basque In Labor Force | Age 20-64 Correlation Chart
The statistical analysis conducted on geographies consisting of 256,687,224 people shows a mild positive correlation between the proportion of Chileans and labor force participation rate among population between the ages 20 and 64 in the United States with a correlation coefficient (R) of 0.390 and weighted average of 80.1%. Similarly, the statistical analysis conducted on geographies consisting of 165,779,636 people shows a poor positive correlation between the proportion of Basques and labor force participation rate among population between the ages 20 and 64 in the United States with a correlation coefficient (R) of 0.154 and weighted average of 78.7%, a difference of 1.8%.
In Labor Force | Age 20-64 Correlation Summary
| Measurement | Chilean | Basque |
| Minimum | 61.1% | 47.2% |
| Maximum | 100.0% | 100.0% |
| Range | 38.9% | 52.8% |
| Mean | 80.0% | 76.8% |
| Median | 80.0% | 77.8% |
| Interquartile 25% (IQ1) | 76.2% | 71.2% |
| Interquartile 75% (IQ3) | 82.8% | 79.8% |
| Interquartile Range (IQR) | 6.6% | 8.6% |
| Standard Deviation (Sample) | 7.2% | 11.0% |
| Standard Deviation (Population) | 7.1% | 11.0% |
Similar Demographics by In Labor Force | Age 20-64
Demographics Similar to Chileans by In Labor Force | Age 20-64
In terms of in labor force | age 20-64, the demographic groups most similar to Chileans are Jordanian (80.1%, a difference of 0.010%), Immigrants from Egypt (80.1%, a difference of 0.010%), Croatian (80.1%, a difference of 0.010%), Immigrants from Venezuela (80.1%, a difference of 0.010%), and Polish (80.1%, a difference of 0.010%).
| Demographics | Rating | Rank | In Labor Force | Age 20-64 |
| German Russians | 97.3 /100 | #81 | Exceptional 80.1% |
| Immigrants | Japan | 97.3 /100 | #82 | Exceptional 80.1% |
| Colombians | 97.3 /100 | #83 | Exceptional 80.1% |
| Immigrants | Latvia | 97.2 /100 | #84 | Exceptional 80.1% |
| Jordanians | 97.2 /100 | #85 | Exceptional 80.1% |
| Immigrants | Egypt | 97.1 /100 | #86 | Exceptional 80.1% |
| Croatians | 97.1 /100 | #87 | Exceptional 80.1% |
| Chileans | 97.0 /100 | #88 | Exceptional 80.1% |
| Immigrants | Venezuela | 96.8 /100 | #89 | Exceptional 80.1% |
| Poles | 96.8 /100 | #90 | Exceptional 80.1% |
| Uruguayans | 96.7 /100 | #91 | Exceptional 80.1% |
| Ghanaians | 96.7 /100 | #92 | Exceptional 80.1% |
| Immigrants | Belarus | 96.4 /100 | #93 | Exceptional 80.1% |
| Immigrants | Asia | 96.0 /100 | #94 | Exceptional 80.1% |
| Yugoslavians | 95.9 /100 | #95 | Exceptional 80.1% |
Demographics Similar to Basques by In Labor Force | Age 20-64
In terms of in labor force | age 20-64, the demographic groups most similar to Basques are Immigrants from Lebanon (78.7%, a difference of 0.0%), Immigrants from Honduras (78.7%, a difference of 0.010%), Hawaiian (78.7%, a difference of 0.020%), Celtic (78.7%, a difference of 0.020%), and Guatemalan (78.7%, a difference of 0.040%).
| Demographics | Rating | Rank | In Labor Force | Age 20-64 |
| Immigrants | Trinidad and Tobago | 1.1 /100 | #246 | Tragic 78.8% |
| Immigrants | Germany | 1.0 /100 | #247 | Tragic 78.8% |
| Immigrants | Caribbean | 1.0 /100 | #248 | Tragic 78.8% |
| English | 0.9 /100 | #249 | Tragic 78.8% |
| Hondurans | 0.8 /100 | #250 | Tragic 78.8% |
| Barbadians | 0.7 /100 | #251 | Tragic 78.8% |
| Immigrants | Honduras | 0.6 /100 | #252 | Tragic 78.7% |
| Basques | 0.5 /100 | #253 | Tragic 78.7% |
| Immigrants | Lebanon | 0.5 /100 | #254 | Tragic 78.7% |
| Hawaiians | 0.5 /100 | #255 | Tragic 78.7% |
| Celtics | 0.5 /100 | #256 | Tragic 78.7% |
| Guatemalans | 0.4 /100 | #257 | Tragic 78.7% |
| Immigrants | Guatemala | 0.4 /100 | #258 | Tragic 78.7% |
| Tsimshian | 0.4 /100 | #259 | Tragic 78.7% |
| Immigrants | Fiji | 0.3 /100 | #260 | Tragic 78.6% |