Immigrants from North Macedonia vs Basque In Labor Force | Age 20-64
COMPARE
Immigrants from North Macedonia
Basque
In Labor Force | Age 20-64
In Labor Force | Age 20-64 Comparison
Immigrants from North Macedonia
Basques
80.7%
IN LABOR FORCE | AGE 20-64
99.9/ 100
METRIC RATING
30th/ 347
METRIC RANK
78.7%
IN LABOR FORCE | AGE 20-64
0.5/ 100
METRIC RATING
253rd/ 347
METRIC RANK
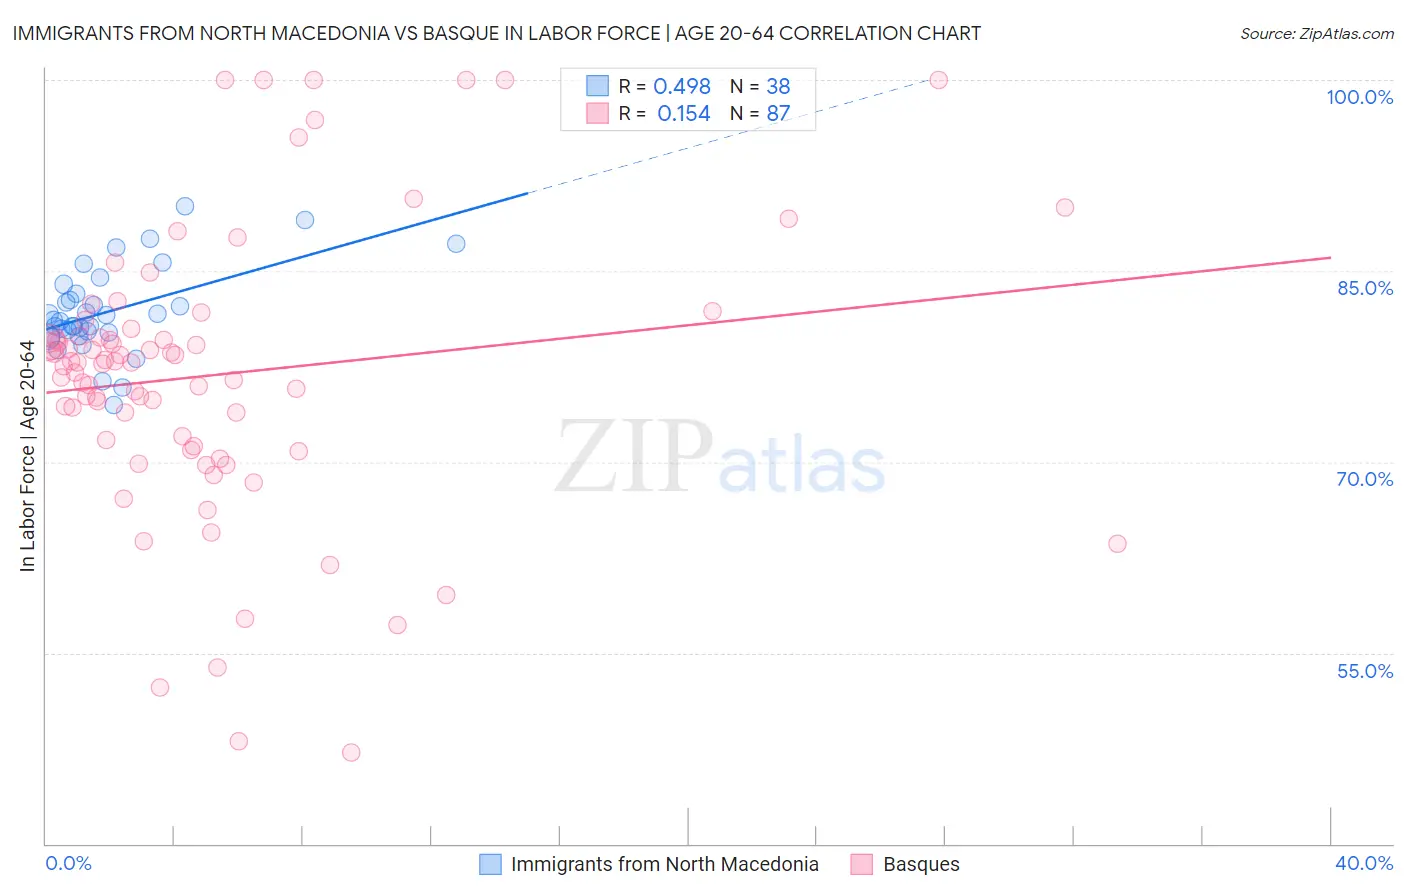
Immigrants from North Macedonia vs Basque In Labor Force | Age 20-64 Correlation Chart
The statistical analysis conducted on geographies consisting of 74,317,186 people shows a moderate positive correlation between the proportion of Immigrants from North Macedonia and labor force participation rate among population between the ages 20 and 64 in the United States with a correlation coefficient (R) of 0.498 and weighted average of 80.7%. Similarly, the statistical analysis conducted on geographies consisting of 165,779,636 people shows a poor positive correlation between the proportion of Basques and labor force participation rate among population between the ages 20 and 64 in the United States with a correlation coefficient (R) of 0.154 and weighted average of 78.7%, a difference of 2.5%.
In Labor Force | Age 20-64 Correlation Summary
| Measurement | Immigrants from North Macedonia | Basque |
| Minimum | 74.4% | 47.2% |
| Maximum | 90.1% | 100.0% |
| Range | 15.7% | 52.8% |
| Mean | 81.8% | 76.8% |
| Median | 81.1% | 77.8% |
| Interquartile 25% (IQ1) | 80.1% | 71.2% |
| Interquartile 75% (IQ3) | 83.2% | 79.8% |
| Interquartile Range (IQR) | 3.1% | 8.6% |
| Standard Deviation (Sample) | 3.4% | 11.0% |
| Standard Deviation (Population) | 3.4% | 11.0% |
Similar Demographics by In Labor Force | Age 20-64
Demographics Similar to Immigrants from North Macedonia by In Labor Force | Age 20-64
In terms of in labor force | age 20-64, the demographic groups most similar to Immigrants from North Macedonia are Immigrants from South Central Asia (80.7%, a difference of 0.010%), Immigrants from Uganda (80.7%, a difference of 0.020%), Immigrants from Lithuania (80.7%, a difference of 0.020%), Immigrants from Kenya (80.7%, a difference of 0.030%), and Immigrants from Ireland (80.7%, a difference of 0.030%).
| Demographics | Rating | Rank | In Labor Force | Age 20-64 |
| Immigrants | Bosnia and Herzegovina | 100.0 /100 | #23 | Exceptional 80.8% |
| Immigrants | Morocco | 100.0 /100 | #24 | Exceptional 80.8% |
| Kenyans | 100.0 /100 | #25 | Exceptional 80.8% |
| Immigrants | Serbia | 100.0 /100 | #26 | Exceptional 80.8% |
| Immigrants | Kenya | 99.9 /100 | #27 | Exceptional 80.7% |
| Immigrants | Uganda | 99.9 /100 | #28 | Exceptional 80.7% |
| Immigrants | South Central Asia | 99.9 /100 | #29 | Exceptional 80.7% |
| Immigrants | North Macedonia | 99.9 /100 | #30 | Exceptional 80.7% |
| Immigrants | Lithuania | 99.9 /100 | #31 | Exceptional 80.7% |
| Immigrants | Ireland | 99.9 /100 | #32 | Exceptional 80.7% |
| Chinese | 99.9 /100 | #33 | Exceptional 80.7% |
| Immigrants | Brazil | 99.9 /100 | #34 | Exceptional 80.7% |
| Immigrants | Poland | 99.9 /100 | #35 | Exceptional 80.6% |
| Paraguayans | 99.8 /100 | #36 | Exceptional 80.6% |
| Immigrants | Moldova | 99.8 /100 | #37 | Exceptional 80.6% |
Demographics Similar to Basques by In Labor Force | Age 20-64
In terms of in labor force | age 20-64, the demographic groups most similar to Basques are Immigrants from Lebanon (78.7%, a difference of 0.0%), Immigrants from Honduras (78.7%, a difference of 0.010%), Hawaiian (78.7%, a difference of 0.020%), Celtic (78.7%, a difference of 0.020%), and Guatemalan (78.7%, a difference of 0.040%).
| Demographics | Rating | Rank | In Labor Force | Age 20-64 |
| Immigrants | Trinidad and Tobago | 1.1 /100 | #246 | Tragic 78.8% |
| Immigrants | Germany | 1.0 /100 | #247 | Tragic 78.8% |
| Immigrants | Caribbean | 1.0 /100 | #248 | Tragic 78.8% |
| English | 0.9 /100 | #249 | Tragic 78.8% |
| Hondurans | 0.8 /100 | #250 | Tragic 78.8% |
| Barbadians | 0.7 /100 | #251 | Tragic 78.8% |
| Immigrants | Honduras | 0.6 /100 | #252 | Tragic 78.7% |
| Basques | 0.5 /100 | #253 | Tragic 78.7% |
| Immigrants | Lebanon | 0.5 /100 | #254 | Tragic 78.7% |
| Hawaiians | 0.5 /100 | #255 | Tragic 78.7% |
| Celtics | 0.5 /100 | #256 | Tragic 78.7% |
| Guatemalans | 0.4 /100 | #257 | Tragic 78.7% |
| Immigrants | Guatemala | 0.4 /100 | #258 | Tragic 78.7% |
| Tsimshian | 0.4 /100 | #259 | Tragic 78.7% |
| Immigrants | Fiji | 0.3 /100 | #260 | Tragic 78.6% |