Canadian vs Basque Unemployment Among Ages 25 to 29 years
COMPARE
Canadian
Basque
Unemployment Among Ages 25 to 29 years
Unemployment Among Ages 25 to 29 years Comparison
Canadians
Basques
6.8%
UNEMPLOYMENT AMONG AGES 25 TO 29 YEARS
16.9/ 100
METRIC RATING
210th/ 347
METRIC RANK
6.8%
UNEMPLOYMENT AMONG AGES 25 TO 29 YEARS
22.5/ 100
METRIC RATING
201st/ 347
METRIC RANK
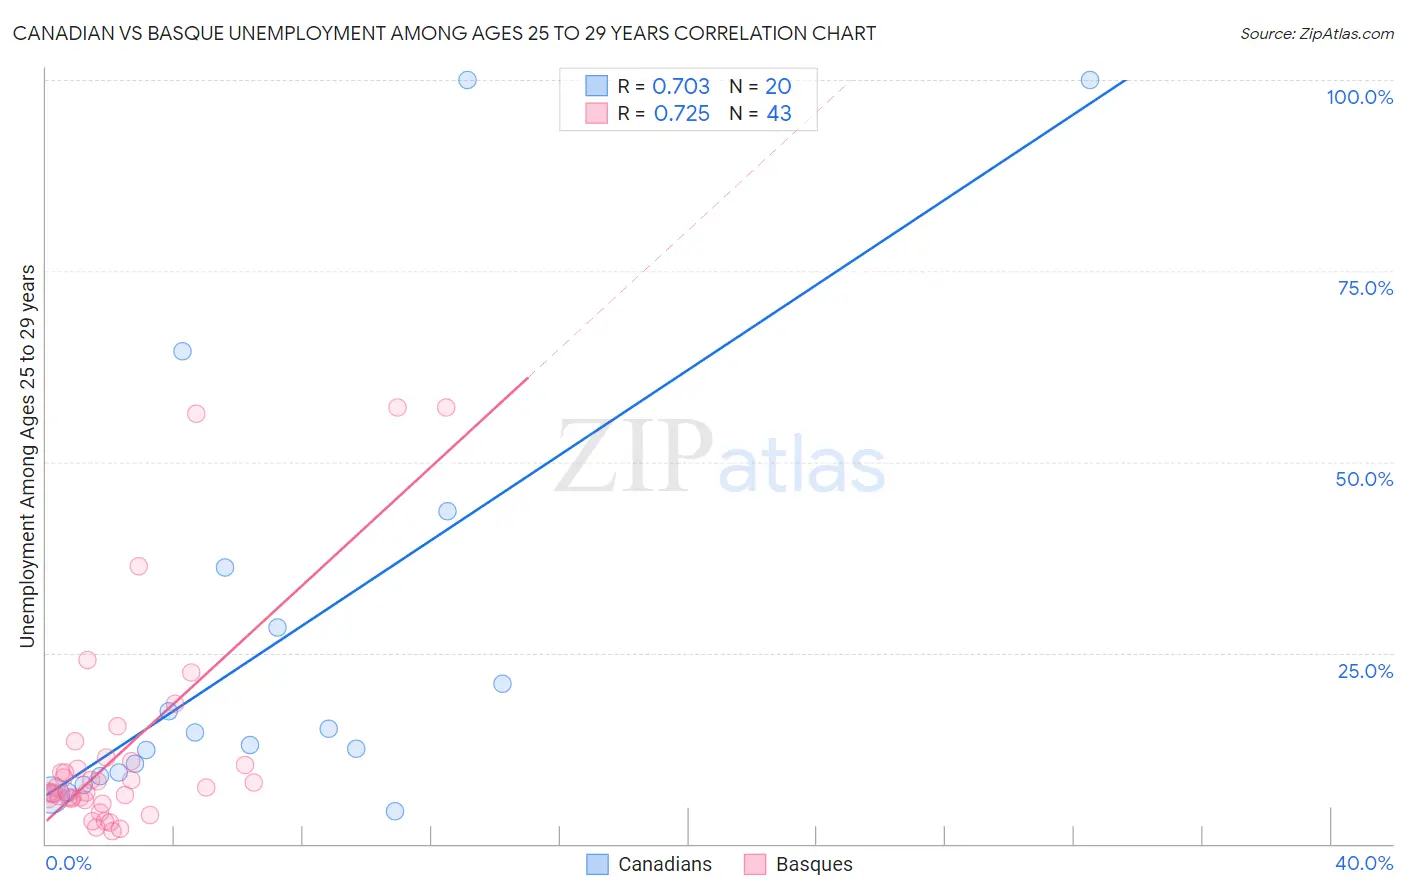
Canadian vs Basque Unemployment Among Ages 25 to 29 years Correlation Chart
The statistical analysis conducted on geographies consisting of 408,428,546 people shows a strong positive correlation between the proportion of Canadians and unemployment rate among population between the ages 25 and 29 in the United States with a correlation coefficient (R) of 0.703 and weighted average of 6.8%. Similarly, the statistical analysis conducted on geographies consisting of 162,150,990 people shows a strong positive correlation between the proportion of Basques and unemployment rate among population between the ages 25 and 29 in the United States with a correlation coefficient (R) of 0.725 and weighted average of 6.8%, a difference of 0.53%.
Unemployment Among Ages 25 to 29 years Correlation Summary
| Measurement | Canadian | Basque |
| Minimum | 4.3% | 1.7% |
| Maximum | 100.0% | 57.1% |
| Range | 95.7% | 55.4% |
| Mean | 26.6% | 12.1% |
| Median | 13.7% | 7.3% |
| Interquartile 25% (IQ1) | 9.0% | 5.9% |
| Interquartile 75% (IQ3) | 32.2% | 10.9% |
| Interquartile Range (IQR) | 23.2% | 5.0% |
| Standard Deviation (Sample) | 29.1% | 14.0% |
| Standard Deviation (Population) | 28.4% | 13.8% |
Demographics Similar to Canadians and Basques by Unemployment Among Ages 25 to 29 years
In terms of unemployment among ages 25 to 29 years, the demographic groups most similar to Canadians are Hawaiian (6.8%, a difference of 0.020%), Immigrants from Philippines (6.8%, a difference of 0.030%), Immigrants from Cabo Verde (6.8%, a difference of 0.080%), Immigrants from Germany (6.8%, a difference of 0.20%), and Immigrants from Syria (6.8%, a difference of 0.20%). Similarly, the demographic groups most similar to Basques are South American Indian (6.8%, a difference of 0.070%), Immigrants from Argentina (6.8%, a difference of 0.080%), Immigrants from Norway (6.8%, a difference of 0.11%), Guamanian/Chamorro (6.8%, a difference of 0.15%), and Immigrants from Southern Europe (6.8%, a difference of 0.17%).
| Demographics | Rating | Rank | Unemployment Among Ages 25 to 29 years |
| Immigrants | Western Asia | 27.3 /100 | #195 | Fair 6.7% |
| Hungarians | 26.8 /100 | #196 | Fair 6.8% |
| Italians | 26.5 /100 | #197 | Fair 6.8% |
| Immigrants | Southern Europe | 24.6 /100 | #198 | Fair 6.8% |
| Guamanians/Chamorros | 24.3 /100 | #199 | Fair 6.8% |
| South American Indians | 23.3 /100 | #200 | Fair 6.8% |
| Basques | 22.5 /100 | #201 | Fair 6.8% |
| Immigrants | Argentina | 21.6 /100 | #202 | Fair 6.8% |
| Immigrants | Norway | 21.2 /100 | #203 | Fair 6.8% |
| Scotch-Irish | 20.0 /100 | #204 | Poor 6.8% |
| Immigrants | England | 19.8 /100 | #205 | Poor 6.8% |
| Ugandans | 19.8 /100 | #206 | Poor 6.8% |
| Immigrants | Denmark | 19.0 /100 | #207 | Poor 6.8% |
| Immigrants | Germany | 18.8 /100 | #208 | Poor 6.8% |
| Hawaiians | 17.1 /100 | #209 | Poor 6.8% |
| Canadians | 16.9 /100 | #210 | Poor 6.8% |
| Immigrants | Philippines | 16.7 /100 | #211 | Poor 6.8% |
| Immigrants | Cabo Verde | 16.2 /100 | #212 | Poor 6.8% |
| Immigrants | Syria | 15.1 /100 | #213 | Poor 6.8% |
| Liberians | 14.7 /100 | #214 | Poor 6.8% |
| Spanish | 14.4 /100 | #215 | Poor 6.8% |