Canadian vs Basque Child Poverty Under the Age of 16

COMPARE

Canadian
Race
Ancestry
AfghanAfricanAlaska NativeAlaskan AthabascanAlbanianAleutAlsatianAmericanApacheArabArapahoArgentineanArmenianAssyrian/Chaldean/SyriacAustralianAustrianBahamianBangladeshiBarbadianBelgianBelizeanBermudanBhutaneseBlackfeetBolivianBrazilianBritishBritish West IndianBulgarianBurmeseCajunCambodianCanadianCape VerdeanCarpatho RusynCelticCentral AmericanCentral American IndianCherokeeCheyenneChickasawChileanChineseChippewaChoctawColombianColvilleComancheCosta RicanCreeCreekCroatianCrowCubanCypriotCzechCzechoslovakianDanishDelawareDominicanDutchDutch West IndianEastern EuropeanEcuadorianEgyptianEnglishEstonianEthiopianEuropeanFijianFilipinoFinnishFrenchFrench American IndianFrench CanadianGermanGerman RussianGhanaianGreekGuamanian/ChamorroGuatemalanGuyaneseHaitianHmongHonduranHopiHoumaHungarianIcelanderIndian (Asian)IndonesianInupiatIranianIraqiIrishIroquoisIsraeliItalianJamaicanJapaneseJordanianKenyanKiowaKoreanLaotianLatvianLebaneseLiberianLithuanianLumbeeLuxembourgerMacedonianMalaysianMalteseMarshalleseMenomineeMexicanMexican American IndianMongolianMoroccanNative HawaiianNavajoNepaleseNew ZealanderNicaraguanNigerianNorthern EuropeanNorwegianOkinawanOsageOttawaPaiutePakistaniPalestinianPanamanianParaguayanPennsylvania GermanPeruvianPimaPolishPortuguesePotawatomiPuebloPuerto RicanPuget Sound SalishRomanianRussianSalvadoranSamoanScandinavianScotch-IrishScottishSeminoleSenegaleseSerbianShoshoneSierra LeoneanSiouxSlavicSlovakSloveneSomaliSouth AfricanSouth AmericanSouth American IndianSoviet UnionSpaniardSpanishSpanish AmericanSpanish American IndianSri LankanSubsaharan AfricanSudaneseSwedishSwissSyrianTaiwaneseThaiTlingit-HaidaTohono O'OdhamTonganTrinidadian and TobagonianTsimshianTurkishU.S. Virgin IslanderUgandanUkrainianUruguayanUteVenezuelanVietnameseWelshWest IndianYakamaYaquiYugoslavianYumanYup'ikZimbabwean
Immigration
NonimmigrantsImmigrantsAfghanistanAfricaAlbaniaArgentinaArmeniaAsiaAustraliaAustriaBahamasBangladeshBarbadosBelarusBelgiumBelizeBoliviaBosnia and HerzegovinaBrazilBulgariaBurma/MyanmarCabo VerdeCambodiaCameroonCanadaCaribbeanCentral AmericaChileChinaColombiaCongoCosta RicaCroatiaCubaCzechoslovakiaDenmarkDominicaDominican RepublicEastern AfricaEastern AsiaEastern EuropeEcuadorEgyptEl SalvadorEnglandEritreaEthiopiaEuropeFijiFranceGermanyGhanaGreeceGrenadaGuatemalaGuyanaHaitiHondurasHong KongHungaryIndiaIndonesiaIranIraqIrelandIsraelItalyJamaicaJapanJordanKazakhstanKenyaKoreaKuwaitLaosLatin AmericaLatviaLebanonLiberiaLithuaniaMalaysiaMexicoMicronesiaMiddle AfricaMoldovaMoroccoNepalNetherlandsNicaraguaNigeriaNorth AmericaNorth MacedoniaNorthern AfricaNorthern EuropeNorwayOceaniaPakistanPanamaPeruPhilippinesPolandPortugalRomaniaRussiaSaudi ArabiaScotlandSenegalSerbiaSierra LeoneSingaporeSomaliaSouth AfricaSouth AmericaSouth Central AsiaSouth Eastern AsiaSouthern EuropeSpainSri LankaSt. Vincent and the GrenadinesSudanSwedenSwitzerlandSyriaTaiwanThailandTrinidad and TobagoTurkeyUgandaUkraineUruguayUzbekistanVenezuelaVietnamWest IndiesWestern AfricaWestern AsiaWestern EuropeYemenZaireZimbabweAzores
Basque
Race
Ancestry
AfghanAfricanAlaska NativeAlaskan AthabascanAlbanianAleutAlsatianAmericanApacheArabArapahoArgentineanArmenianAssyrian/Chaldean/SyriacAustralianAustrianBahamianBangladeshiBarbadianBasqueBelgianBelizeanBermudanBhutaneseBlackfeetBolivianBrazilianBritishBritish West IndianBulgarianBurmeseCajunCambodianCape VerdeanCarpatho RusynCelticCentral AmericanCentral American IndianCherokeeCheyenneChickasawChileanChineseChippewaChoctawColombianColvilleComancheCosta RicanCreeCreekCroatianCrowCubanCypriotCzechCzechoslovakianDanishDelawareDominicanDutchDutch West IndianEastern EuropeanEcuadorianEgyptianEnglishEstonianEthiopianEuropeanFijianFilipinoFinnishFrenchFrench American IndianFrench CanadianGermanGerman RussianGhanaianGreekGuamanian/ChamorroGuatemalanGuyaneseHaitianHmongHonduranHopiHoumaHungarianIcelanderIndian (Asian)IndonesianInupiatIranianIraqiIrishIroquoisIsraeliItalianJamaicanJapaneseJordanianKenyanKiowaKoreanLaotianLatvianLebaneseLiberianLithuanianLumbeeLuxembourgerMacedonianMalaysianMalteseMarshalleseMenomineeMexicanMexican American IndianMongolianMoroccanNative HawaiianNavajoNepaleseNew ZealanderNicaraguanNigerianNorthern EuropeanNorwegianOkinawanOsageOttawaPaiutePakistaniPalestinianPanamanianParaguayanPennsylvania GermanPeruvianPimaPolishPortuguesePotawatomiPuebloPuerto RicanPuget Sound SalishRomanianRussianSalvadoranSamoanScandinavianScotch-IrishScottishSeminoleSenegaleseSerbianShoshoneSierra LeoneanSiouxSlavicSlovakSloveneSomaliSouth AfricanSouth AmericanSouth American IndianSoviet UnionSpaniardSpanishSpanish AmericanSpanish American IndianSri LankanSubsaharan AfricanSudaneseSwedishSwissSyrianTaiwaneseThaiTlingit-HaidaTohono O'OdhamTonganTrinidadian and TobagonianTsimshianTurkishU.S. Virgin IslanderUgandanUkrainianUruguayanUteVenezuelanVietnameseWelshWest IndianYakamaYaquiYugoslavianYumanYup'ikZimbabwean
Immigration
NonimmigrantsImmigrantsAfghanistanAfricaAlbaniaArgentinaArmeniaAsiaAustraliaAustriaBahamasBangladeshBarbadosBelarusBelgiumBelizeBoliviaBosnia and HerzegovinaBrazilBulgariaBurma/MyanmarCabo VerdeCambodiaCameroonCanadaCaribbeanCentral AmericaChileChinaColombiaCongoCosta RicaCroatiaCubaCzechoslovakiaDenmarkDominicaDominican RepublicEastern AfricaEastern AsiaEastern EuropeEcuadorEgyptEl SalvadorEnglandEritreaEthiopiaEuropeFijiFranceGermanyGhanaGreeceGrenadaGuatemalaGuyanaHaitiHondurasHong KongHungaryIndiaIndonesiaIranIraqIrelandIsraelItalyJamaicaJapanJordanKazakhstanKenyaKoreaKuwaitLaosLatin AmericaLatviaLebanonLiberiaLithuaniaMalaysiaMexicoMicronesiaMiddle AfricaMoldovaMoroccoNepalNetherlandsNicaraguaNigeriaNorth AmericaNorth MacedoniaNorthern AfricaNorthern EuropeNorwayOceaniaPakistanPanamaPeruPhilippinesPolandPortugalRomaniaRussiaSaudi ArabiaScotlandSenegalSerbiaSierra LeoneSingaporeSomaliaSouth AfricaSouth AmericaSouth Central AsiaSouth Eastern AsiaSouthern EuropeSpainSri LankaSt. Vincent and the GrenadinesSudanSwedenSwitzerlandSyriaTaiwanThailandTrinidad and TobagoTurkeyUgandaUkraineUruguayUzbekistanVenezuelaVietnamWest IndiesWestern AfricaWestern AsiaWestern EuropeYemenZaireZimbabweAzores
Child Poverty Under the Age of 16
Income
Poverty
Unemployment
Labor Participation
Family Structure
Vehicle Availability
Education Level
Disability

Child Poverty Under the Age of 16 Comparison

Canadians

Basques

Excellent
Exceptional
15.2%
CHILD POVERTY UNDER THE AGE OF 16
89.1/ 100
METRIC RATING
132nd/ 347
METRIC RANK
14.8%
CHILD POVERTY UNDER THE AGE OF 16
94.7/ 100
METRIC RATING
105th/ 347
METRIC RANK

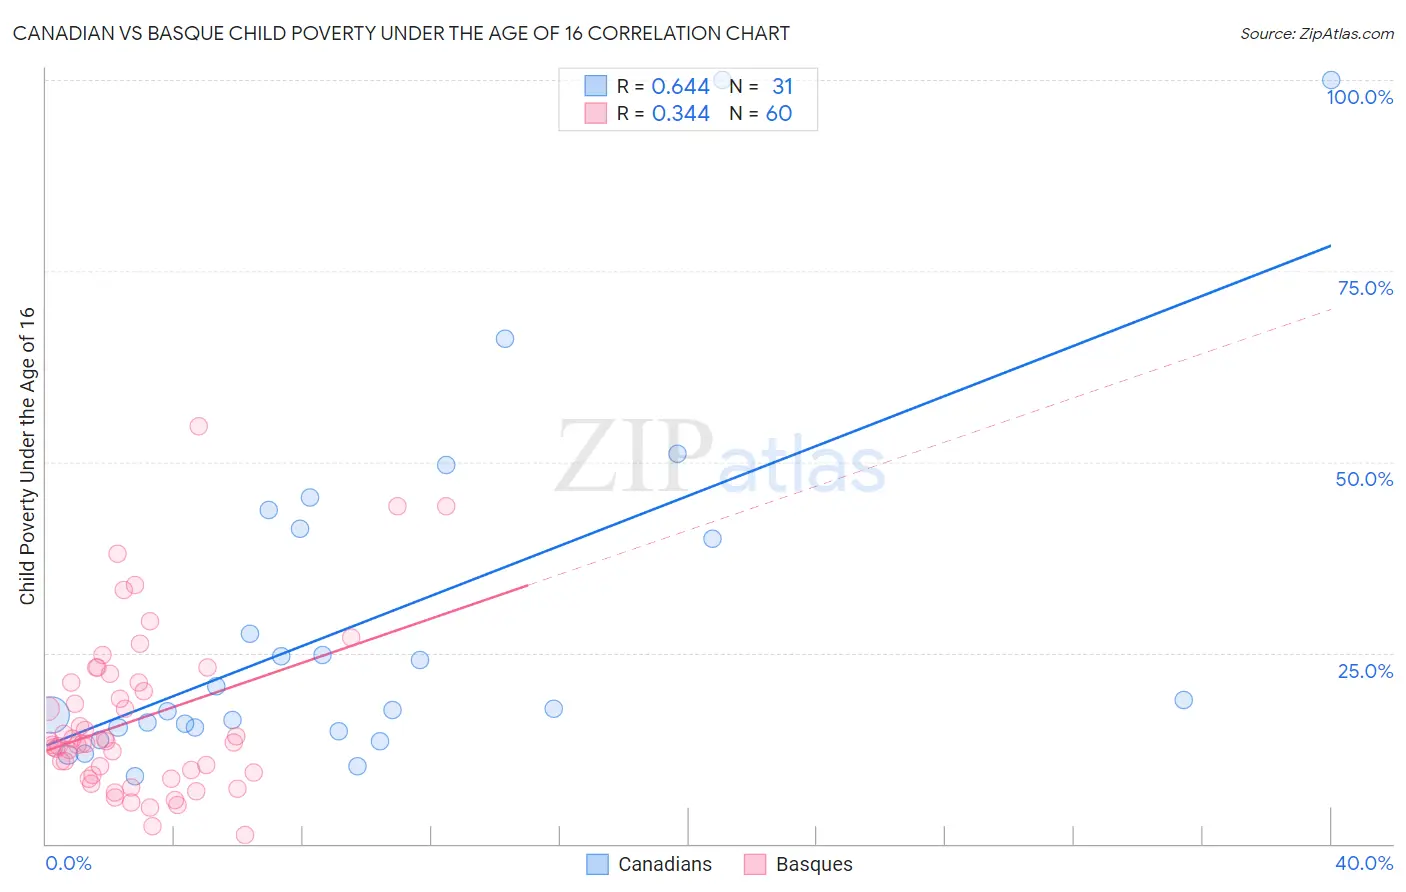
Canadian vs Basque Child Poverty Under the Age of 16 Correlation Chart

The statistical analysis conducted on geographies consisting of 431,912,296 people shows a significant positive correlation between the proportion of Canadians and poverty level among children under the age of 16 in the United States with a correlation coefficient (R) of 0.644 and weighted average of 15.2%. Similarly, the statistical analysis conducted on geographies consisting of 165,163,292 people shows a mild positive correlation between the proportion of Basques and poverty level among children under the age of 16 in the United States with a correlation coefficient (R) of 0.344 and weighted average of 14.8%, a difference of 2.5%.
Canadian vs Basque Child Poverty Under the Age of 16

Child Poverty Under the Age of 16 Correlation Summary

MeasurementCanadianBasque
Minimum8.9%1.2%
Maximum100.0%54.6%
Range91.1%53.4%
Mean29.3%16.3%
Median17.7%13.2%
Interquartile 25% (IQ1)15.2%9.2%
Interquartile 75% (IQ3)41.2%21.1%
Interquartile Range (IQR)26.0%11.9%
Standard Deviation (Sample)23.7%10.7%
Standard Deviation (Population)23.3%10.6%

Similar Demographics by Child Poverty Under the Age of 16

Demographics Similar to Canadians by Child Poverty Under the Age of 16

In terms of child poverty under the age of 16, the demographic groups most similar to Canadians are Immigrants from South Eastern Asia (15.2%, a difference of 0.050%), Armenian (15.2%, a difference of 0.090%), Mongolian (15.2%, a difference of 0.12%), Native Hawaiian (15.2%, a difference of 0.14%), and Albanian (15.2%, a difference of 0.18%).
DemographicsRating | RankChild Poverty Under the Age of 16
Palestinians
90.9
/100
|
#125
Exceptional
15.1%
Portuguese
90.6
/100
|
#126
Exceptional
15.1%
Immigrants | Western Europe
90.3
/100
|
#127
Exceptional
15.1%
Immigrants | Kazakhstan
90.2
/100
|
#128
Exceptional
15.1%
Immigrants | Southern Europe
89.7
/100
|
#129
Excellent
15.1%
Mongolians
89.5
/100
|
#130
Excellent
15.2%
Armenians
89.4
/100
|
#131
Excellent
15.2%
Canadians
89.1
/100
|
#132
Excellent
15.2%
Immigrants | South Eastern Asia
89.0
/100
|
#133
Excellent
15.2%
Native Hawaiians
88.7
/100
|
#134
Excellent
15.2%
Albanians
88.6
/100
|
#135
Excellent
15.2%
Immigrants | Spain
87.3
/100
|
#136
Excellent
15.3%
Peruvians
87.2
/100
|
#137
Excellent
15.3%
Welsh
87.2
/100
|
#138
Excellent
15.3%
Immigrants | Vietnam
87.1
/100
|
#139
Excellent
15.3%

Demographics Similar to Basques by Child Poverty Under the Age of 16

In terms of child poverty under the age of 16, the demographic groups most similar to Basques are Immigrants from England (14.8%, a difference of 0.11%), Serbian (14.8%, a difference of 0.13%), Immigrants from Egypt (14.8%, a difference of 0.15%), Chilean (14.8%, a difference of 0.19%), and Romanian (14.8%, a difference of 0.20%).
DemographicsRating | RankChild Poverty Under the Age of 16
Immigrants | Belarus
95.7
/100
|
#98
Exceptional
14.7%
British
95.5
/100
|
#99
Exceptional
14.7%
Dutch
95.1
/100
|
#100
Exceptional
14.8%
Immigrants | Switzerland
95.1
/100
|
#101
Exceptional
14.8%
Romanians
95.0
/100
|
#102
Exceptional
14.8%
Immigrants | Egypt
94.9
/100
|
#103
Exceptional
14.8%
Immigrants | England
94.8
/100
|
#104
Exceptional
14.8%
Basques
94.7
/100
|
#105
Exceptional
14.8%
Serbians
94.5
/100
|
#106
Exceptional
14.8%
Chileans
94.4
/100
|
#107
Exceptional
14.8%
Jordanians
94.2
/100
|
#108
Exceptional
14.8%
Tlingit-Haida
94.1
/100
|
#109
Exceptional
14.9%
English
93.5
/100
|
#110
Exceptional
14.9%
Immigrants | Denmark
93.5
/100
|
#111
Exceptional
14.9%
Irish
93.4
/100
|
#112
Exceptional
14.9%