Taiwanese vs Nonimmigrants In Labor Force | Age 20-24
COMPARE
Taiwanese
Nonimmigrants
In Labor Force | Age 20-24
In Labor Force | Age 20-24 Comparison
Taiwanese
Nonimmigrants
74.7%
IN LABOR FORCE | AGE 20-24
23.2/ 100
METRIC RATING
199th/ 347
METRIC RANK
76.2%
IN LABOR FORCE | AGE 20-24
98.5/ 100
METRIC RATING
96th/ 347
METRIC RANK
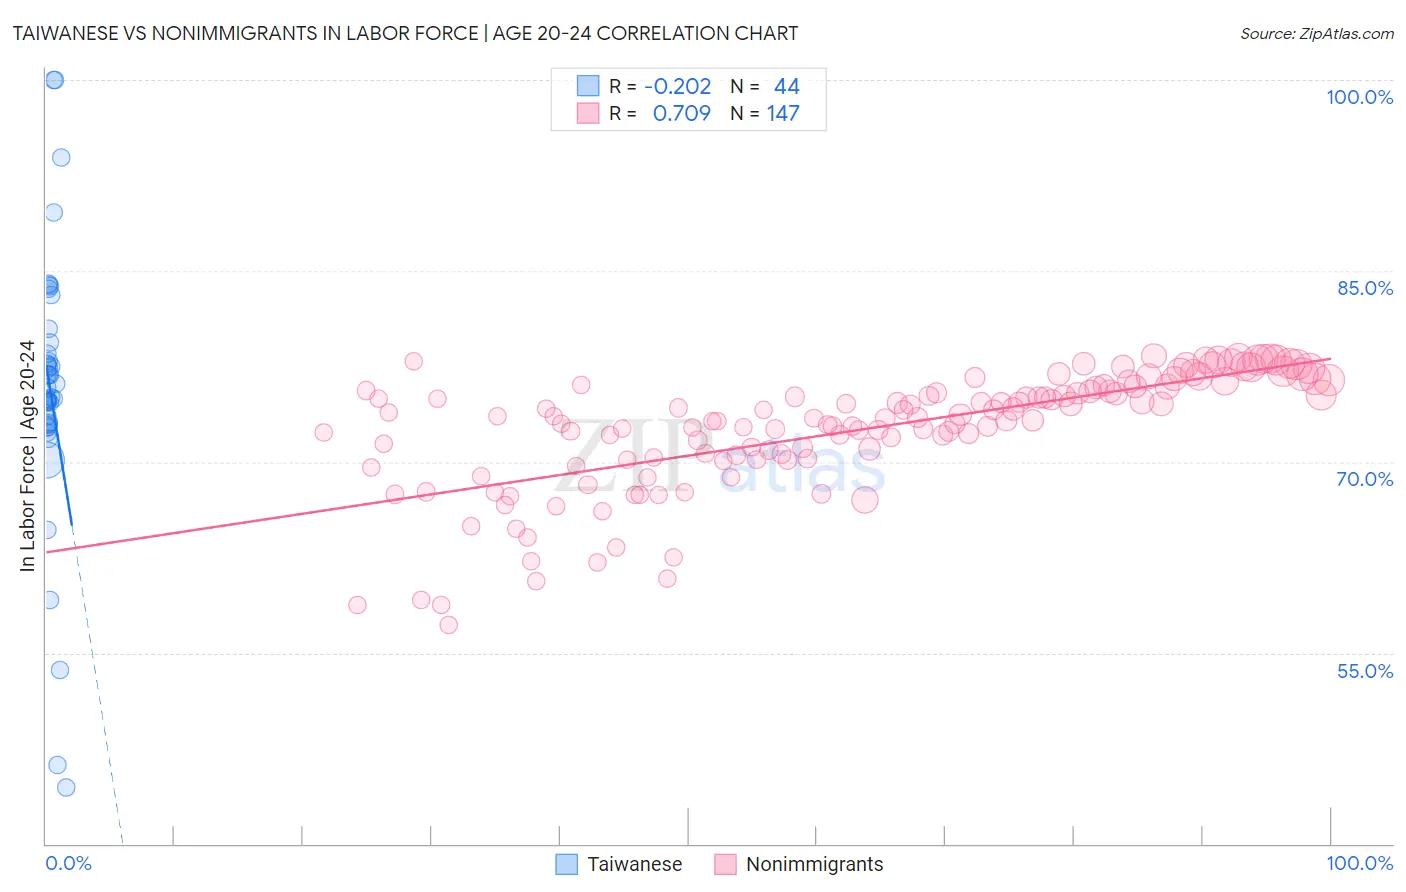
Taiwanese vs Nonimmigrants In Labor Force | Age 20-24 Correlation Chart
The statistical analysis conducted on geographies consisting of 31,724,936 people shows a weak negative correlation between the proportion of Taiwanese and labor force participation rate among population between the ages 20 and 24 in the United States with a correlation coefficient (R) of -0.202 and weighted average of 74.7%. Similarly, the statistical analysis conducted on geographies consisting of 582,321,268 people shows a strong positive correlation between the proportion of Nonimmigrants and labor force participation rate among population between the ages 20 and 24 in the United States with a correlation coefficient (R) of 0.709 and weighted average of 76.2%, a difference of 2.0%.
In Labor Force | Age 20-24 Correlation Summary
| Measurement | Taiwanese | Nonimmigrants |
| Minimum | 44.4% | 57.2% |
| Maximum | 100.0% | 78.3% |
| Range | 55.6% | 21.1% |
| Mean | 75.7% | 72.5% |
| Median | 75.4% | 73.4% |
| Interquartile 25% (IQ1) | 73.0% | 70.2% |
| Interquartile 75% (IQ3) | 78.9% | 75.8% |
| Interquartile Range (IQR) | 6.0% | 5.6% |
| Standard Deviation (Sample) | 10.7% | 4.7% |
| Standard Deviation (Population) | 10.6% | 4.6% |
Similar Demographics by In Labor Force | Age 20-24
Demographics Similar to Taiwanese by In Labor Force | Age 20-24
In terms of in labor force | age 20-24, the demographic groups most similar to Taiwanese are Immigrants from Nigeria (74.7%, a difference of 0.020%), Nigerian (74.7%, a difference of 0.030%), Eastern European (74.8%, a difference of 0.040%), Immigrants from Vietnam (74.7%, a difference of 0.040%), and Panamanian (74.7%, a difference of 0.040%).
| Demographics | Rating | Rank | In Labor Force | Age 20-24 |
| Immigrants | Europe | 27.5 /100 | #192 | Fair 74.8% |
| Alsatians | 27.1 /100 | #193 | Fair 74.8% |
| Immigrants | Denmark | 25.8 /100 | #194 | Fair 74.8% |
| Eastern Europeans | 25.4 /100 | #195 | Fair 74.8% |
| Immigrants | Vietnam | 25.1 /100 | #196 | Fair 74.7% |
| Panamanians | 25.0 /100 | #197 | Fair 74.7% |
| Immigrants | Nigeria | 24.2 /100 | #198 | Fair 74.7% |
| Taiwanese | 23.2 /100 | #199 | Fair 74.7% |
| Nigerians | 21.9 /100 | #200 | Fair 74.7% |
| Choctaw | 21.4 /100 | #201 | Fair 74.7% |
| Moroccans | 20.4 /100 | #202 | Fair 74.7% |
| Immigrants | Northern Africa | 17.9 /100 | #203 | Poor 74.6% |
| Immigrants | Italy | 17.6 /100 | #204 | Poor 74.6% |
| Inupiat | 17.6 /100 | #205 | Poor 74.6% |
| Sioux | 17.5 /100 | #206 | Poor 74.6% |
Demographics Similar to Nonimmigrants by In Labor Force | Age 20-24
In terms of in labor force | age 20-24, the demographic groups most similar to Nonimmigrants are Potawatomi (76.2%, a difference of 0.010%), Immigrants from Germany (76.2%, a difference of 0.010%), Immigrants from Lithuania (76.1%, a difference of 0.10%), Immigrants from Oceania (76.1%, a difference of 0.10%), and Hungarian (76.3%, a difference of 0.11%).
| Demographics | Rating | Rank | In Labor Force | Age 20-24 |
| Bulgarians | 99.2 /100 | #89 | Exceptional 76.4% |
| Immigrants | Burma/Myanmar | 99.1 /100 | #90 | Exceptional 76.3% |
| Sierra Leoneans | 99.0 /100 | #91 | Exceptional 76.3% |
| Maltese | 98.9 /100 | #92 | Exceptional 76.3% |
| Hungarians | 98.9 /100 | #93 | Exceptional 76.3% |
| Potawatomi | 98.5 /100 | #94 | Exceptional 76.2% |
| Immigrants | Germany | 98.5 /100 | #95 | Exceptional 76.2% |
| Immigrants | Nonimmigrants | 98.5 /100 | #96 | Exceptional 76.2% |
| Immigrants | Lithuania | 98.0 /100 | #97 | Exceptional 76.1% |
| Immigrants | Oceania | 98.0 /100 | #98 | Exceptional 76.1% |
| Americans | 97.8 /100 | #99 | Exceptional 76.1% |
| Shoshone | 97.8 /100 | #100 | Exceptional 76.1% |
| Immigrants | Poland | 97.7 /100 | #101 | Exceptional 76.1% |
| Latvians | 97.6 /100 | #102 | Exceptional 76.1% |
| Immigrants | North Macedonia | 97.5 /100 | #103 | Exceptional 76.1% |