Cambodian vs Nonimmigrants 4 or more Vehicles in Household
COMPARE
Cambodian
Nonimmigrants
4 or more Vehicles in Household
4 or more Vehicles in Household Comparison
Cambodians
Nonimmigrants
5.5%
4 OR MORE VEHICLES IN HOUSEHOLD
0.5/ 100
METRIC RATING
275th/ 347
METRIC RANK
7.2%
4 OR MORE VEHICLES IN HOUSEHOLD
99.6/ 100
METRIC RATING
88th/ 347
METRIC RANK
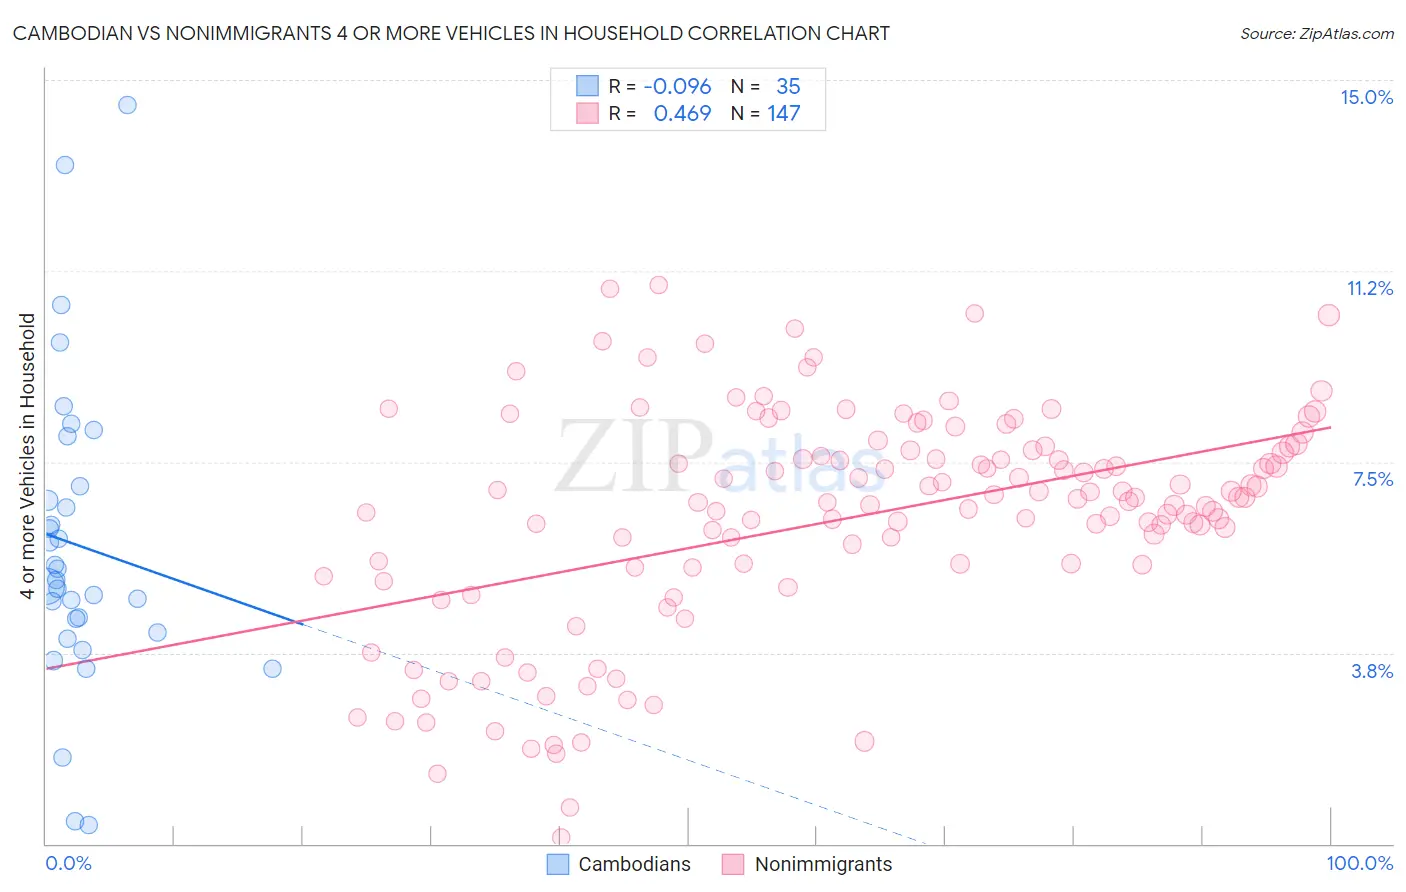
Cambodian vs Nonimmigrants 4 or more Vehicles in Household Correlation Chart
The statistical analysis conducted on geographies consisting of 102,385,573 people shows a slight negative correlation between the proportion of Cambodians and percentage of households with 4 or more vehicles available in the United States with a correlation coefficient (R) of -0.096 and weighted average of 5.5%. Similarly, the statistical analysis conducted on geographies consisting of 580,369,833 people shows a moderate positive correlation between the proportion of Nonimmigrants and percentage of households with 4 or more vehicles available in the United States with a correlation coefficient (R) of 0.469 and weighted average of 7.2%, a difference of 31.6%.
4 or more Vehicles in Household Correlation Summary
| Measurement | Cambodian | Nonimmigrants |
| Minimum | 0.37% | 0.13% |
| Maximum | 14.5% | 11.0% |
| Range | 14.1% | 10.9% |
| Mean | 5.9% | 6.4% |
| Median | 5.2% | 6.8% |
| Interquartile 25% (IQ1) | 4.2% | 5.5% |
| Interquartile 75% (IQ3) | 7.0% | 7.7% |
| Interquartile Range (IQR) | 2.9% | 2.3% |
| Standard Deviation (Sample) | 3.0% | 2.2% |
| Standard Deviation (Population) | 3.0% | 2.2% |
Similar Demographics by 4 or more Vehicles in Household
Demographics Similar to Cambodians by 4 or more Vehicles in Household
In terms of 4 or more vehicles in household, the demographic groups most similar to Cambodians are Immigrants from Latvia (5.5%, a difference of 0.010%), Black/African American (5.5%, a difference of 0.12%), Immigrants from Bulgaria (5.5%, a difference of 0.13%), Macedonian (5.5%, a difference of 0.24%), and Immigrants from Kazakhstan (5.5%, a difference of 0.27%).
| Demographics | Rating | Rank | 4 or more Vehicles in Household |
| Colombians | 0.7 /100 | #268 | Tragic 5.5% |
| Carpatho Rusyns | 0.7 /100 | #269 | Tragic 5.5% |
| Okinawans | 0.6 /100 | #270 | Tragic 5.5% |
| Immigrants | Sudan | 0.6 /100 | #271 | Tragic 5.5% |
| Immigrants | Kazakhstan | 0.6 /100 | #272 | Tragic 5.5% |
| Macedonians | 0.6 /100 | #273 | Tragic 5.5% |
| Blacks/African Americans | 0.6 /100 | #274 | Tragic 5.5% |
| Cambodians | 0.5 /100 | #275 | Tragic 5.5% |
| Immigrants | Latvia | 0.5 /100 | #276 | Tragic 5.5% |
| Immigrants | Bulgaria | 0.5 /100 | #277 | Tragic 5.5% |
| Immigrants | Eastern Europe | 0.4 /100 | #278 | Tragic 5.4% |
| Immigrants | Uruguay | 0.3 /100 | #279 | Tragic 5.4% |
| Alsatians | 0.3 /100 | #280 | Tragic 5.4% |
| Immigrants | Western Africa | 0.3 /100 | #281 | Tragic 5.4% |
| Immigrants | Spain | 0.3 /100 | #282 | Tragic 5.4% |
Demographics Similar to Nonimmigrants by 4 or more Vehicles in Household
In terms of 4 or more vehicles in household, the demographic groups most similar to Nonimmigrants are Delaware (7.2%, a difference of 0.020%), Immigrants from Indonesia (7.2%, a difference of 0.080%), Cree (7.2%, a difference of 0.26%), British (7.2%, a difference of 0.33%), and Creek (7.2%, a difference of 0.41%).
| Demographics | Rating | Rank | 4 or more Vehicles in Household |
| Finns | 99.8 /100 | #81 | Exceptional 7.3% |
| Northern Europeans | 99.8 /100 | #82 | Exceptional 7.3% |
| Potawatomi | 99.7 /100 | #83 | Exceptional 7.3% |
| Afghans | 99.7 /100 | #84 | Exceptional 7.3% |
| Cree | 99.7 /100 | #85 | Exceptional 7.2% |
| Immigrants | Indonesia | 99.6 /100 | #86 | Exceptional 7.2% |
| Delaware | 99.6 /100 | #87 | Exceptional 7.2% |
| Immigrants | Nonimmigrants | 99.6 /100 | #88 | Exceptional 7.2% |
| British | 99.6 /100 | #89 | Exceptional 7.2% |
| Creek | 99.6 /100 | #90 | Exceptional 7.2% |
| Assyrians/Chaldeans/Syriacs | 99.4 /100 | #91 | Exceptional 7.2% |
| Immigrants | Latin America | 99.4 /100 | #92 | Exceptional 7.1% |
| Immigrants | Afghanistan | 99.3 /100 | #93 | Exceptional 7.1% |
| Dutch West Indians | 99.3 /100 | #94 | Exceptional 7.1% |
| Czechoslovakians | 99.3 /100 | #95 | Exceptional 7.1% |