Immigrants from Dominican Republic vs Nonimmigrants In Labor Force | Age 20-24
COMPARE
Immigrants from Dominican Republic
Nonimmigrants
In Labor Force | Age 20-24
In Labor Force | Age 20-24 Comparison
Immigrants from Dominican Republic
Nonimmigrants
71.2%
IN LABOR FORCE | AGE 20-24
0.0/ 100
METRIC RATING
324th/ 347
METRIC RANK
76.2%
IN LABOR FORCE | AGE 20-24
98.5/ 100
METRIC RATING
96th/ 347
METRIC RANK
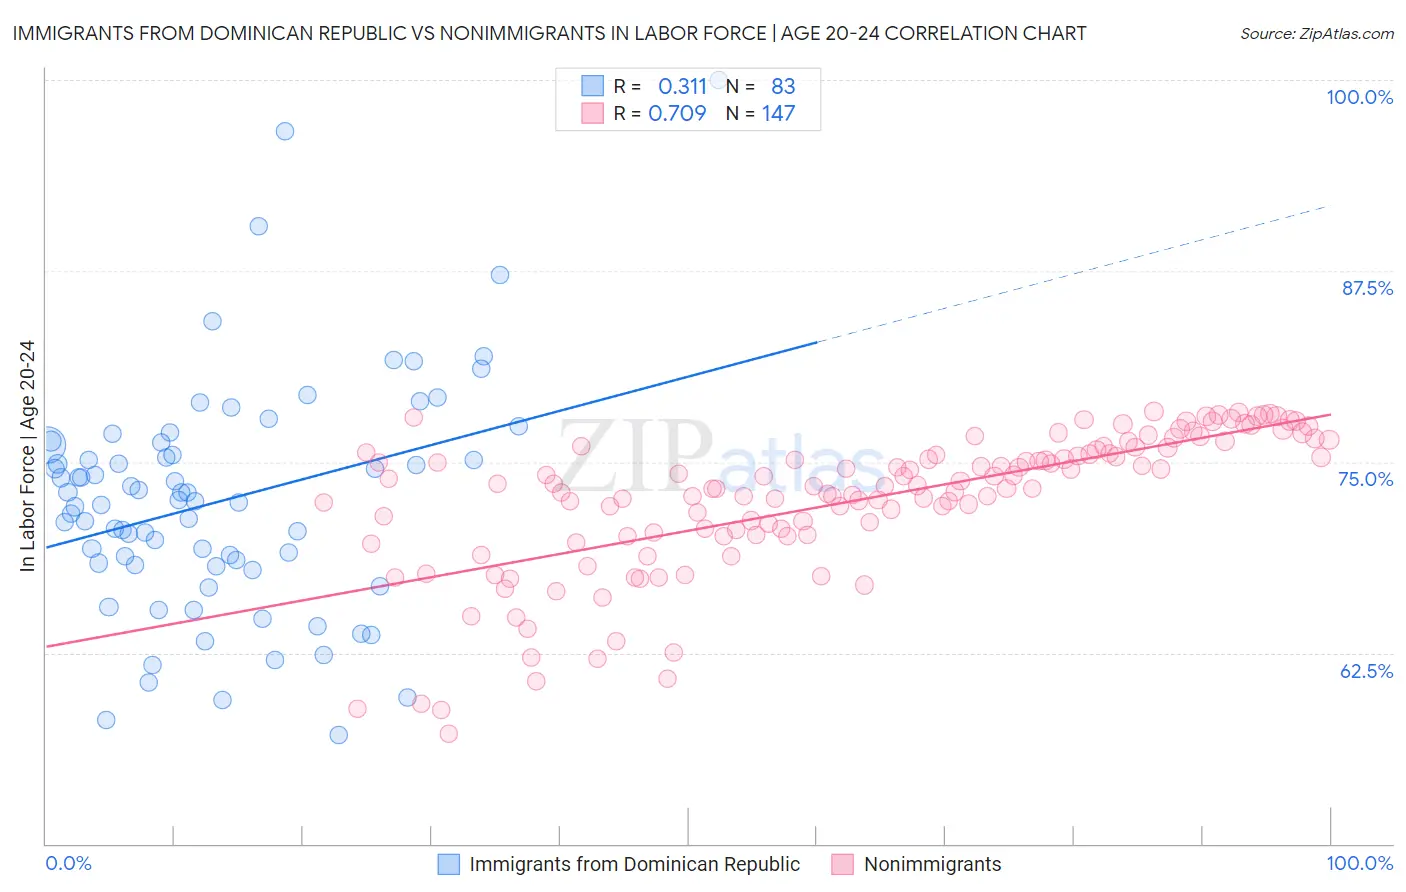
Immigrants from Dominican Republic vs Nonimmigrants In Labor Force | Age 20-24 Correlation Chart
The statistical analysis conducted on geographies consisting of 275,100,632 people shows a mild positive correlation between the proportion of Immigrants from Dominican Republic and labor force participation rate among population between the ages 20 and 24 in the United States with a correlation coefficient (R) of 0.311 and weighted average of 71.2%. Similarly, the statistical analysis conducted on geographies consisting of 582,321,268 people shows a strong positive correlation between the proportion of Nonimmigrants and labor force participation rate among population between the ages 20 and 24 in the United States with a correlation coefficient (R) of 0.709 and weighted average of 76.2%, a difference of 7.0%.
In Labor Force | Age 20-24 Correlation Summary
| Measurement | Immigrants from Dominican Republic | Nonimmigrants |
| Minimum | 57.1% | 57.2% |
| Maximum | 100.0% | 78.3% |
| Range | 42.9% | 21.1% |
| Mean | 72.4% | 72.5% |
| Median | 72.4% | 73.4% |
| Interquartile 25% (IQ1) | 68.2% | 70.2% |
| Interquartile 75% (IQ3) | 76.1% | 75.8% |
| Interquartile Range (IQR) | 7.9% | 5.6% |
| Standard Deviation (Sample) | 7.6% | 4.7% |
| Standard Deviation (Population) | 7.6% | 4.6% |
Similar Demographics by In Labor Force | Age 20-24
Demographics Similar to Immigrants from Dominican Republic by In Labor Force | Age 20-24
In terms of in labor force | age 20-24, the demographic groups most similar to Immigrants from Dominican Republic are West Indian (71.3%, a difference of 0.090%), Barbadian (71.1%, a difference of 0.11%), Dominican (71.1%, a difference of 0.19%), Immigrants from Trinidad and Tobago (71.1%, a difference of 0.19%), and Immigrants from China (71.1%, a difference of 0.21%).
| Demographics | Rating | Rank | In Labor Force | Age 20-24 |
| Immigrants | Armenia | 0.0 /100 | #317 | Tragic 71.7% |
| Immigrants | Hong Kong | 0.0 /100 | #318 | Tragic 71.6% |
| Immigrants | Israel | 0.0 /100 | #319 | Tragic 71.6% |
| Trinidadians and Tobagonians | 0.0 /100 | #320 | Tragic 71.5% |
| Immigrants | Taiwan | 0.0 /100 | #321 | Tragic 71.5% |
| Filipinos | 0.0 /100 | #322 | Tragic 71.4% |
| West Indians | 0.0 /100 | #323 | Tragic 71.3% |
| Immigrants | Dominican Republic | 0.0 /100 | #324 | Tragic 71.2% |
| Barbadians | 0.0 /100 | #325 | Tragic 71.1% |
| Dominicans | 0.0 /100 | #326 | Tragic 71.1% |
| Immigrants | Trinidad and Tobago | 0.0 /100 | #327 | Tragic 71.1% |
| Immigrants | China | 0.0 /100 | #328 | Tragic 71.1% |
| Yup'ik | 0.0 /100 | #329 | Tragic 70.9% |
| Vietnamese | 0.0 /100 | #330 | Tragic 70.6% |
| Immigrants | Bangladesh | 0.0 /100 | #331 | Tragic 70.6% |
Demographics Similar to Nonimmigrants by In Labor Force | Age 20-24
In terms of in labor force | age 20-24, the demographic groups most similar to Nonimmigrants are Potawatomi (76.2%, a difference of 0.010%), Immigrants from Germany (76.2%, a difference of 0.010%), Immigrants from Lithuania (76.1%, a difference of 0.10%), Immigrants from Oceania (76.1%, a difference of 0.10%), and Hungarian (76.3%, a difference of 0.11%).
| Demographics | Rating | Rank | In Labor Force | Age 20-24 |
| Bulgarians | 99.2 /100 | #89 | Exceptional 76.4% |
| Immigrants | Burma/Myanmar | 99.1 /100 | #90 | Exceptional 76.3% |
| Sierra Leoneans | 99.0 /100 | #91 | Exceptional 76.3% |
| Maltese | 98.9 /100 | #92 | Exceptional 76.3% |
| Hungarians | 98.9 /100 | #93 | Exceptional 76.3% |
| Potawatomi | 98.5 /100 | #94 | Exceptional 76.2% |
| Immigrants | Germany | 98.5 /100 | #95 | Exceptional 76.2% |
| Immigrants | Nonimmigrants | 98.5 /100 | #96 | Exceptional 76.2% |
| Immigrants | Lithuania | 98.0 /100 | #97 | Exceptional 76.1% |
| Immigrants | Oceania | 98.0 /100 | #98 | Exceptional 76.1% |
| Americans | 97.8 /100 | #99 | Exceptional 76.1% |
| Shoshone | 97.8 /100 | #100 | Exceptional 76.1% |
| Immigrants | Poland | 97.7 /100 | #101 | Exceptional 76.1% |
| Latvians | 97.6 /100 | #102 | Exceptional 76.1% |
| Immigrants | North Macedonia | 97.5 /100 | #103 | Exceptional 76.1% |