Immigrants from Egypt vs Immigrants from Uruguay In Labor Force | Age 20-24
COMPARE
Immigrants from Egypt
Immigrants from Uruguay
In Labor Force | Age 20-24
In Labor Force | Age 20-24 Comparison
Immigrants from Egypt
Immigrants from Uruguay
73.8%
IN LABOR FORCE | AGE 20-24
1.2/ 100
METRIC RATING
251st/ 347
METRIC RANK
74.6%
IN LABOR FORCE | AGE 20-24
15.8/ 100
METRIC RATING
208th/ 347
METRIC RANK
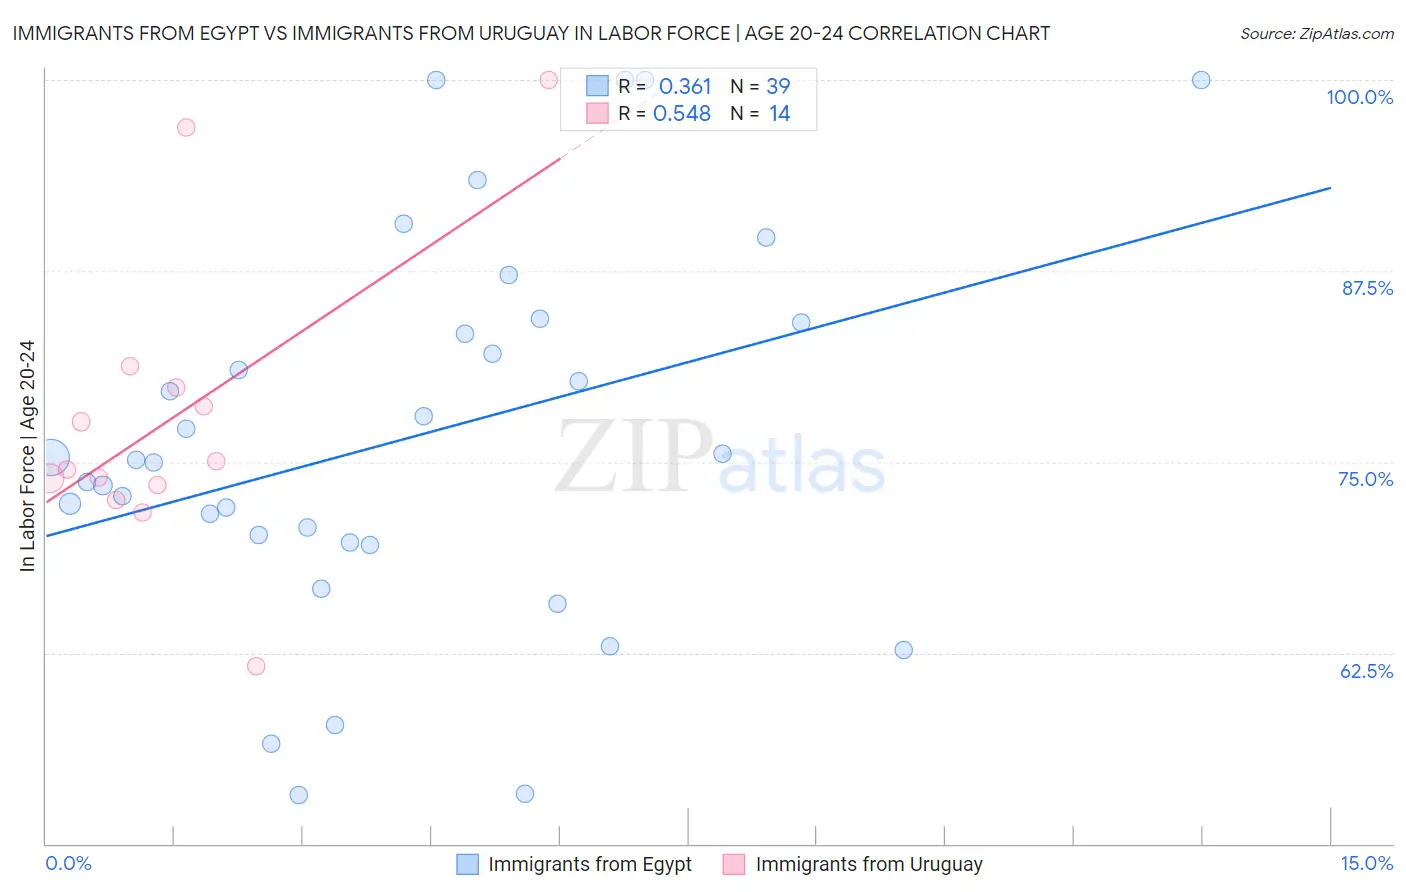
Immigrants from Egypt vs Immigrants from Uruguay In Labor Force | Age 20-24 Correlation Chart
The statistical analysis conducted on geographies consisting of 245,464,045 people shows a mild positive correlation between the proportion of Immigrants from Egypt and labor force participation rate among population between the ages 20 and 24 in the United States with a correlation coefficient (R) of 0.361 and weighted average of 73.8%. Similarly, the statistical analysis conducted on geographies consisting of 133,248,800 people shows a substantial positive correlation between the proportion of Immigrants from Uruguay and labor force participation rate among population between the ages 20 and 24 in the United States with a correlation coefficient (R) of 0.548 and weighted average of 74.6%, a difference of 1.0%.
In Labor Force | Age 20-24 Correlation Summary
| Measurement | Immigrants from Egypt | Immigrants from Uruguay |
| Minimum | 53.2% | 61.6% |
| Maximum | 100.0% | 100.0% |
| Range | 46.8% | 38.4% |
| Mean | 76.6% | 77.9% |
| Median | 75.1% | 74.8% |
| Interquartile 25% (IQ1) | 69.7% | 73.5% |
| Interquartile 75% (IQ3) | 84.1% | 79.9% |
| Interquartile Range (IQR) | 14.4% | 6.4% |
| Standard Deviation (Sample) | 12.5% | 9.9% |
| Standard Deviation (Population) | 12.3% | 9.5% |
Similar Demographics by In Labor Force | Age 20-24
Demographics Similar to Immigrants from Egypt by In Labor Force | Age 20-24
In terms of in labor force | age 20-24, the demographic groups most similar to Immigrants from Egypt are Black/African American (73.9%, a difference of 0.020%), Immigrants from Belgium (73.9%, a difference of 0.020%), Immigrants from Kazakhstan (73.8%, a difference of 0.020%), Immigrants from Saudi Arabia (73.9%, a difference of 0.070%), and Arapaho (73.8%, a difference of 0.070%).
| Demographics | Rating | Rank | In Labor Force | Age 20-24 |
| Immigrants | South Central Asia | 1.9 /100 | #244 | Tragic 74.0% |
| Turks | 1.8 /100 | #245 | Tragic 73.9% |
| Immigrants | Panama | 1.6 /100 | #246 | Tragic 73.9% |
| Colville | 1.5 /100 | #247 | Tragic 73.9% |
| Immigrants | Saudi Arabia | 1.5 /100 | #248 | Tragic 73.9% |
| Blacks/African Americans | 1.3 /100 | #249 | Tragic 73.9% |
| Immigrants | Belgium | 1.3 /100 | #250 | Tragic 73.9% |
| Immigrants | Egypt | 1.2 /100 | #251 | Tragic 73.8% |
| Immigrants | Kazakhstan | 1.1 /100 | #252 | Tragic 73.8% |
| Arapaho | 1.0 /100 | #253 | Tragic 73.8% |
| Ute | 1.0 /100 | #254 | Tragic 73.8% |
| Immigrants | Pakistan | 0.9 /100 | #255 | Tragic 73.8% |
| Spanish American Indians | 0.8 /100 | #256 | Tragic 73.7% |
| Paraguayans | 0.8 /100 | #257 | Tragic 73.7% |
| Egyptians | 0.7 /100 | #258 | Tragic 73.7% |
Demographics Similar to Immigrants from Uruguay by In Labor Force | Age 20-24
In terms of in labor force | age 20-24, the demographic groups most similar to Immigrants from Uruguay are Arab (74.6%, a difference of 0.0%), Albanian (74.6%, a difference of 0.010%), Uruguayan (74.6%, a difference of 0.020%), Immigrants from Australia (74.6%, a difference of 0.030%), and Sioux (74.6%, a difference of 0.040%).
| Demographics | Rating | Rank | In Labor Force | Age 20-24 |
| Choctaw | 21.4 /100 | #201 | Fair 74.7% |
| Moroccans | 20.4 /100 | #202 | Fair 74.7% |
| Immigrants | Northern Africa | 17.9 /100 | #203 | Poor 74.6% |
| Immigrants | Italy | 17.6 /100 | #204 | Poor 74.6% |
| Inupiat | 17.6 /100 | #205 | Poor 74.6% |
| Sioux | 17.5 /100 | #206 | Poor 74.6% |
| Albanians | 16.2 /100 | #207 | Poor 74.6% |
| Immigrants | Uruguay | 15.8 /100 | #208 | Poor 74.6% |
| Arabs | 15.8 /100 | #209 | Poor 74.6% |
| Uruguayans | 15.1 /100 | #210 | Poor 74.6% |
| Immigrants | Australia | 14.7 /100 | #211 | Poor 74.6% |
| Creek | 13.3 /100 | #212 | Poor 74.5% |
| Peruvians | 13.3 /100 | #213 | Poor 74.5% |
| Immigrants | Southern Europe | 13.2 /100 | #214 | Poor 74.5% |
| Immigrants | Ghana | 12.7 /100 | #215 | Poor 74.5% |