Cajun vs Immigrants from Vietnam In Labor Force | Age 16-19
COMPARE
Cajun
Immigrants from Vietnam
In Labor Force | Age 16-19
In Labor Force | Age 16-19 Comparison
Cajuns
Immigrants from Vietnam
37.8%
IN LABOR FORCE | AGE 16-19
93.2/ 100
METRIC RATING
137th/ 347
METRIC RANK
35.0%
IN LABOR FORCE | AGE 16-19
3.4/ 100
METRIC RATING
238th/ 347
METRIC RANK
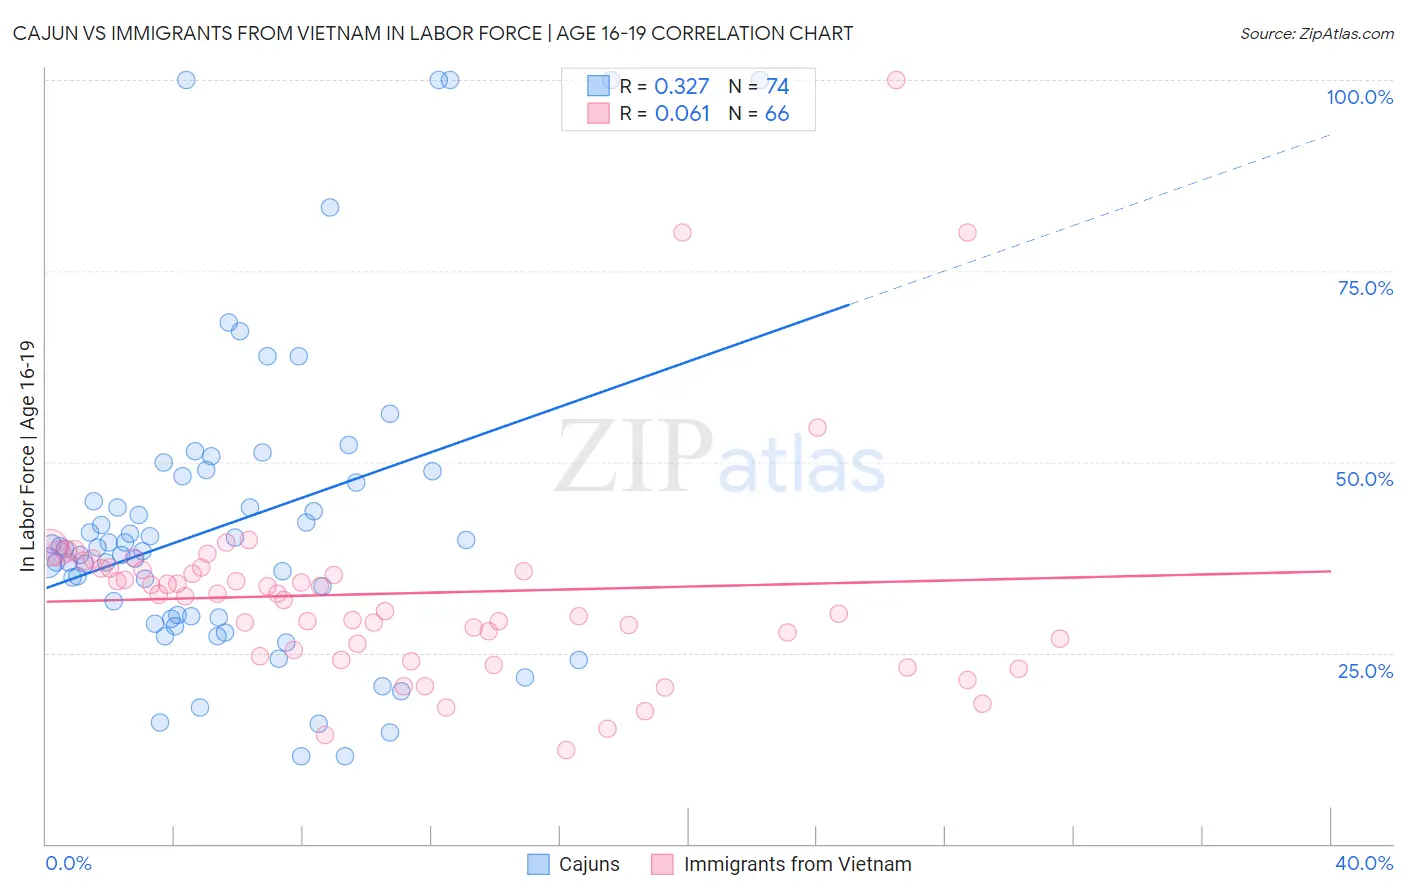
Cajun vs Immigrants from Vietnam In Labor Force | Age 16-19 Correlation Chart
The statistical analysis conducted on geographies consisting of 149,548,332 people shows a mild positive correlation between the proportion of Cajuns and labor force participation rate among population between the ages 16 and 19 in the United States with a correlation coefficient (R) of 0.327 and weighted average of 37.8%. Similarly, the statistical analysis conducted on geographies consisting of 404,448,042 people shows a slight positive correlation between the proportion of Immigrants from Vietnam and labor force participation rate among population between the ages 16 and 19 in the United States with a correlation coefficient (R) of 0.061 and weighted average of 35.0%, a difference of 7.8%.
In Labor Force | Age 16-19 Correlation Summary
| Measurement | Cajun | Immigrants from Vietnam |
| Minimum | 11.5% | 12.3% |
| Maximum | 100.0% | 100.0% |
| Range | 88.5% | 87.7% |
| Mean | 42.1% | 32.8% |
| Median | 38.7% | 32.5% |
| Interquartile 25% (IQ1) | 29.6% | 25.3% |
| Interquartile 75% (IQ3) | 48.1% | 36.1% |
| Interquartile Range (IQR) | 18.5% | 10.7% |
| Standard Deviation (Sample) | 20.5% | 14.1% |
| Standard Deviation (Population) | 20.3% | 14.0% |
Similar Demographics by In Labor Force | Age 16-19
Demographics Similar to Cajuns by In Labor Force | Age 16-19
In terms of in labor force | age 16-19, the demographic groups most similar to Cajuns are Australian (37.8%, a difference of 0.0%), Macedonian (37.8%, a difference of 0.030%), Immigrants from Netherlands (37.8%, a difference of 0.090%), Comanche (37.7%, a difference of 0.23%), and Immigrants from Moldova (37.7%, a difference of 0.24%).
| Demographics | Rating | Rank | In Labor Force | Age 16-19 |
| Immigrants | Zimbabwe | 95.4 /100 | #130 | Exceptional 38.0% |
| Immigrants | Austria | 95.0 /100 | #131 | Exceptional 37.9% |
| Immigrants | Oceania | 94.7 /100 | #132 | Exceptional 37.9% |
| Cheyenne | 94.6 /100 | #133 | Exceptional 37.9% |
| Immigrants | Netherlands | 93.7 /100 | #134 | Exceptional 37.8% |
| Macedonians | 93.4 /100 | #135 | Exceptional 37.8% |
| Australians | 93.2 /100 | #136 | Exceptional 37.8% |
| Cajuns | 93.2 /100 | #137 | Exceptional 37.8% |
| Comanche | 91.9 /100 | #138 | Exceptional 37.7% |
| Immigrants | Moldova | 91.9 /100 | #139 | Exceptional 37.7% |
| Estonians | 91.7 /100 | #140 | Exceptional 37.7% |
| Syrians | 90.7 /100 | #141 | Exceptional 37.6% |
| Sierra Leoneans | 89.7 /100 | #142 | Excellent 37.6% |
| Pakistanis | 89.5 /100 | #143 | Excellent 37.6% |
| Japanese | 89.3 /100 | #144 | Excellent 37.5% |
Demographics Similar to Immigrants from Vietnam by In Labor Force | Age 16-19
In terms of in labor force | age 16-19, the demographic groups most similar to Immigrants from Vietnam are Immigrants from India (35.0%, a difference of 0.050%), Immigrants from Australia (35.1%, a difference of 0.070%), Inupiat (35.0%, a difference of 0.090%), Immigrants from Central America (35.0%, a difference of 0.19%), and Immigrants from Philippines (35.1%, a difference of 0.21%).
| Demographics | Rating | Rank | In Labor Force | Age 16-19 |
| Immigrants | Syria | 4.5 /100 | #231 | Tragic 35.2% |
| Immigrants | Kazakhstan | 4.5 /100 | #232 | Tragic 35.2% |
| Immigrants | France | 4.3 /100 | #233 | Tragic 35.1% |
| Immigrants | Mexico | 4.2 /100 | #234 | Tragic 35.1% |
| Immigrants | Philippines | 4.0 /100 | #235 | Tragic 35.1% |
| Immigrants | Australia | 3.6 /100 | #236 | Tragic 35.1% |
| Immigrants | India | 3.5 /100 | #237 | Tragic 35.0% |
| Immigrants | Vietnam | 3.4 /100 | #238 | Tragic 35.0% |
| Inupiat | 3.2 /100 | #239 | Tragic 35.0% |
| Immigrants | Central America | 3.0 /100 | #240 | Tragic 35.0% |
| Immigrants | Ireland | 2.9 /100 | #241 | Tragic 35.0% |
| Uruguayans | 2.6 /100 | #242 | Tragic 34.9% |
| Pueblo | 2.6 /100 | #243 | Tragic 34.9% |
| Immigrants | Turkey | 2.6 /100 | #244 | Tragic 34.9% |
| Immigrants | Greece | 2.4 /100 | #245 | Tragic 34.9% |